
Explore GeoGebra Graphing Calculator Features
Loading the math board and drawing, please wait…
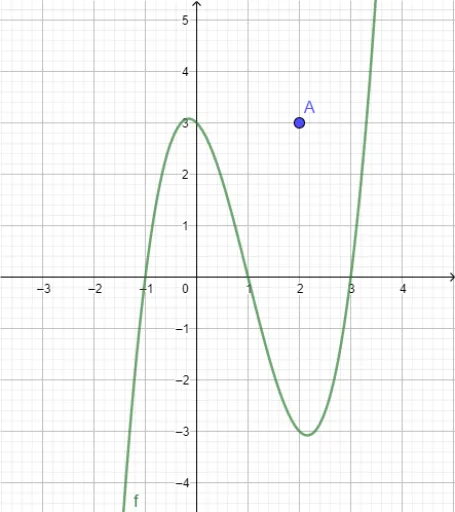
This example demonstrates the main features of GeoGebra Graphing Calculator, including function graphing, coordinate calculation, tangent line drawing, upper and lower sum or Riemann sum, linear regression, and geometric distribution. Core math concepts involved are functions, derivatives, integrals, and probability & statistics. Construction highlights use of GeoGebra commands/objects like f and A for function plotting and coordinate labeling. Suitable for high school and above mathematics learning and teaching.
GeoGebra Commands & Parameters
f(x) = x^(3) - (3 * x^(2)) - x + 3(2, 3)
AI Drawing Prompt Reference
Draw a coordinate system with a cubic polynomial function passing through point (2,3), and display its derivative and integral graphs, along with geometric distribution and linear regression lines to illustrate core concepts of functions, derivatives, integrals, and probability statistics.
The prompt above was compiled from the original drawing commands and is for reference only.