
Experimental Probability Demo
Loading the math board and drawing, please wait…
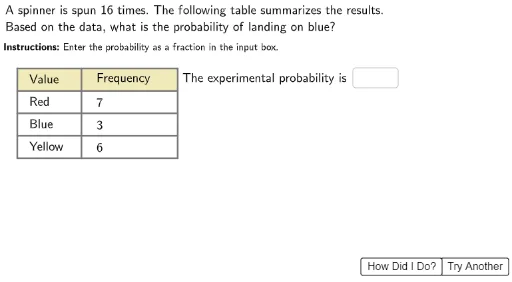
This example demonstrates experimental probability calculation and visualization by simulating random events to show frequency distribution. Core math concepts include probability & statistics, polygons, random variables, function graphs, and integral calculus. GeoGebra commands used are Sequence, Polygon, Segment, Textfield, LaTeX, and If for construction. Suitable for high school probability statistics teaching and introductory mathematical modeling.
GeoGebra Commands & Parameters
Sequence(Segment[StartPoint - (i * (0, TableHeight)), StartPoint + (TableW1 + TableW2, 0) - (i * (0, TableHeight))], i, 0, NumRows) → HorizontalLinesPolygon(StartPoint, StartPoint + (TableW1 + TableW2, 0), StartPoint + (TableW1 + TableW2, (-TableHeight)), StartPoint + (0, (-TableHeight))) → ShadedTop, startpoint, f, g, hSegment(StartPoint, StartPoint - (0, (NumRows * TableHeight))) → LeftSegmentSegment(StartPoint + (TableW1, 0), StartPoint + (TableW1, ((-NumRows) * TableHeight))) → MidSegmentSegment(StartPoint + (TableW1 + TableW2, 0), StartPoint + (TableW1 + TableW2, ((-NumRows) * TableHeight))) → RightSegmentTextfield(StudentAns) → StudentAnswerLaTeX((((((((((("A\ " * object) * "\ is\ ") * action) * "\ ") * NumTrials) * "\ times.\ The\ following\ table\ summarizes\ the\ results.\\ Based\ on\ the\ data,\, what\ is\ the\ probability\ of\ ") * action2) * "\ ") * event) * "?")) → InstructionsLaTeX("Type\ a\ number\ into\ the\ input\ box\\ before\ checking\ your\ answer.") → FeedbackNSLaTeX("Correct!") → FeedbackCorrectLaTeX("That\ is\ not\ correct.\\ Please\ try\ again.") → FeedbackWrong1LaTeX("\times") → WrongLaTeX("\checkmark") → RightIf(favoutcomes ≟ 1, "trial", "trials") → trialsLaTeX("The\ experimental\ probability\ is") → ProbLaTeX((((((((((((((((((((((("There\ were\ " * NumTrials) * "\ ") * trials) * ".\\ ") * eventCap) * "\ ") * was) * "\ observed\ in\ ") * favoutcomes) * "\ ") * trials) * ".\\\ \\ Thus,\, the\ experimental\ probability\\ of\ ") * action2) * "\ ") * event) * "\ is\ \dfrac{") * favoutcomes) * "}{") * NumTrials) * "}") * or) * ".")) → FeedbackWrongPolygon(StartPoint + (TableW1, (-TableHeight)), StartPoint + (TableW1 + TableW2, (-TableHeight)), StartPoint + (TableW1 + TableW2, (-2 * TableHeight)), StartPoint + (TableW1, (-2 * TableHeight))) → Box1, i, j, k, lPolygon(StartPoint + (TableW1, (-2 * TableHeight)), StartPoint + (TableW1 + TableW2, (-2 * TableHeight)), StartPoint + (TableW1 + TableW2, (-3 * TableHeight)), StartPoint + (TableW1, (-3 * TableHeight))) → Box2, m, n, p, qPolygon(StartPoint + (TableW1, (-3 * TableHeight)), StartPoint + (TableW1 + TableW2, (-3 * TableHeight)), StartPoint + (TableW1 + TableW2, (-4 * TableHeight)), StartPoint + (TableW1, (-4 * TableHeight))) → Box3, r, s, t, aPolygon(StartPoint + (TableW1, (-4 * TableHeight)), StartPoint + (TableW1 + TableW2, (-4 * TableHeight)), StartPoint + (TableW1 + TableW2, (-5 * TableHeight)), StartPoint + (TableW1, (-5 * TableHeight))) → Box4, b, c, d, ePolygon(StartPoint + (TableW1, (-5 * TableHeight)), StartPoint + (TableW1 + TableW2, (-5 * TableHeight)), StartPoint + (TableW1 + TableW2, (-6 * TableHeight)), StartPoint + (TableW1, (-6 * TableHeight))) → Box5, f_1, g_1, h_1, i_1Polygon(StartPoint + (TableW1, (-6 * TableHeight)), StartPoint + (TableW1 + TableW2, (-6 * TableHeight)), StartPoint + (TableW1 + TableW2, (-7 * TableHeight)), StartPoint + (TableW1, (-7 * TableHeight))) → Box6, j_1, k_1, l_1, m_1LaTeX("\textbf{Instructions\text{:}}\ Enter\ the\ probability\ as\ a\ fraction\ in\ the\ input\ box.") → Instructions2
AI Drawing Prompt Reference
Draw an experimental probability demonstration diagram, including a table with horizontal lines above it, composed of multiple rectangles representing the results of each trial. Draw three vertical lines on the left side of the table, representing the number of trials, the number of times the event occurred, and the number of times the event did not occur. Above the table, draw an input box to prompt the user to enter the probability. Below the table, draw two text boxes, one for displaying the formula to calculate the experimental probability, and another for showing the user's answer.
The prompt above was compiled from the original drawing commands and is for reference only.