
Expected Value - Discrete Uniform Distribution
Loading the math board and drawing, please wait…
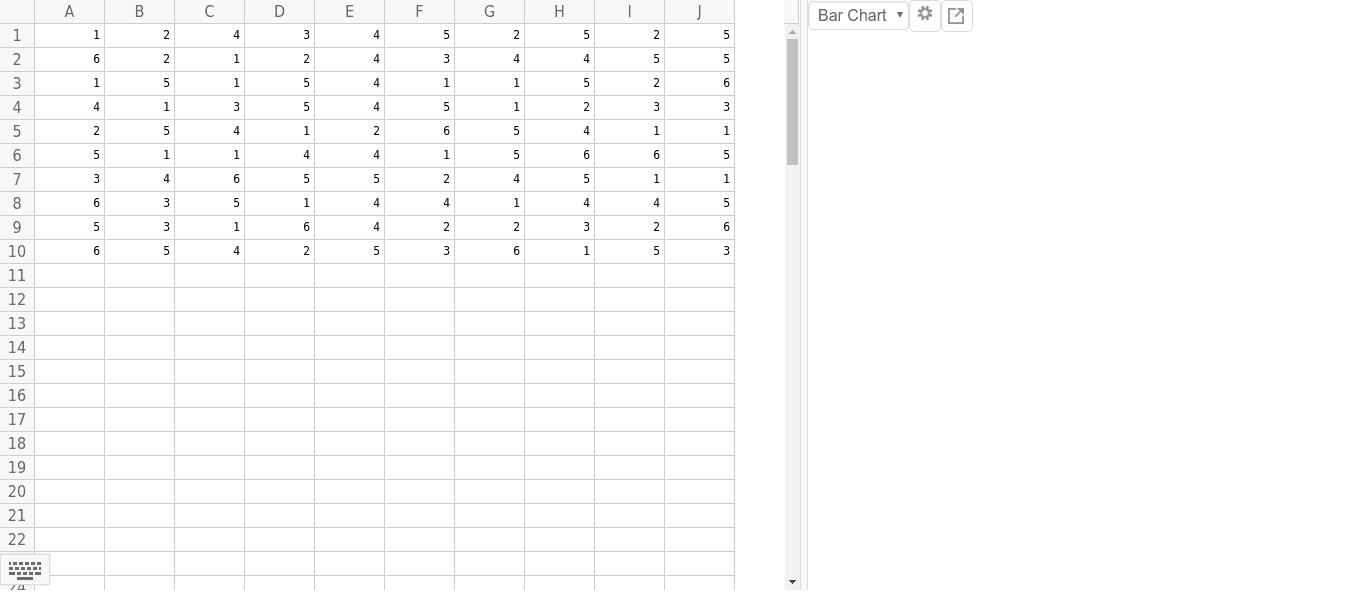
This example demonstrates the calculation and visualization of the expected value under a discrete uniform distribution. Key math concepts include expected value, probability distribution, and random number generation. It is constructed using GeoGebra commands like Random to generate multiple random variables (A1-A10, B1-B10, C1-C10, D1-D10) for simulating the discrete uniform distribution. Suitable for high school and above students learning probability statistics and expected value calculations of random variables.
GeoGebra Commands & Parameters
Random(1, 6) → A1Random(1, 6) → A2Random(1, 6) → A3Random(1, 6) → A4Random(1, 6) → A5Random(1, 6) → A6Random(1, 6) → A7Random(1, 6) → A8Random(1, 6) → A9Random(1, 6) → A10Random(1, 6) → B1Random(1, 6) → B2Random(1, 6) → B3Random(1, 6) → B4Random(1, 6) → B5Random(1, 6) → B6Random(1, 6) → B7Random(1, 6) → B8Random(1, 6) → B9Random(1, 6) → B10Random(1, 6) → C1Random(1, 6) → C2Random(1, 6) → C3Random(1, 6) → C4Random(1, 6) → C5Random(1, 6) → C6Random(1, 6) → C7Random(1, 6) → C8Random(1, 6) → C9Random(1, 6) → C10Random(1, 6) → D1Random(1, 6) → D2Random(1, 6) → D3Random(1, 6) → D4Random(1, 6) → D5Random(1, 6) → D6Random(1, 6) → D7Random(1, 6) → D8Random(1, 6) → D9Random(1, 6) → D10Random(1, 6) → E1Random(1, 6) → E2Random(1, 6) → E3Random(1, 6) → E4Random(1, 6) → E5Random(1, 6) → E6Random(1, 6) → E7Random(1, 6) → E8Random(1, 6) → E9Random(1, 6) → E10Random(1, 6) → F1Random(1, 6) → F2Random(1, 6) → F3Random(1, 6) → F4Random(1, 6) → F5Random(1, 6) → F6Random(1, 6) → F7Random(1, 6) → F8Random(1, 6) → F9Random(1, 6) → F10Random(1, 6) → G1Random(1, 6) → G2Random(1, 6) → G3Random(1, 6) → G4Random(1, 6) → G5Random(1, 6) → G6Random(1, 6) → G7Random(1, 6) → G8Random(1, 6) → G9Random(1, 6) → G10Random(1, 6) → H1Random(1, 6) → H2Random(1, 6) → H3Random(1, 6) → H4Random(1, 6) → H5Random(1, 6) → H6Random(1, 6) → H7Random(1, 6) → H8Random(1, 6) → H9Random(1, 6) → H10Random(1, 6) → I1Random(1, 6) → I2Random(1, 6) → I3Random(1, 6) → I4Random(1, 6) → I5Random(1, 6) → I6Random(1, 6) → I7Random(1, 6) → I8Random(1, 6) → I9Random(1, 6) → I10Random(1, 6) → J1Random(1, 6) → J2Random(1, 6) → J3Random(1, 6) → J4Random(1, 6) → J5Random(1, 6) → J6Random(1, 6) → J7Random(1, 6) → J8Random(1, 6) → J9Random(1, 6) → J10
AI Drawing Prompt Reference
Create a visualization showing the expected value of a discrete uniform distribution by generating four sets of 10 random dice rolls (1 to 6), each set in a different color, calculating the average of each set, and finally plotting the distribution of these averages to visualize the concept of expected value.
The prompt above was compiled from the original drawing commands and is for reference only.