
Expected Value and Standard Deviation
Loading the math board and drawing, please wait…
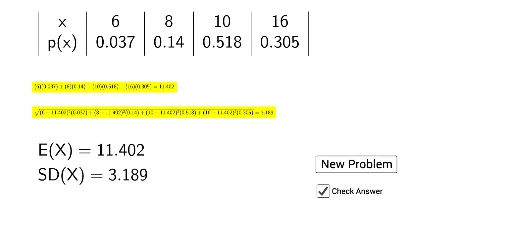
This example demonstrates how to calculate the expected value and standard deviation of a random variable. Key mathematical concepts include expected value and standard deviation. Using GeoGebra commands such as Sequence, Random, and Sort, the distribution of data can be dynamically displayed. Suitable for high school mathematics education, particularly in probability and statistics courses.
GeoGebra Commands & Parameters
Sequence(a, a, 5, 25) → L_1Random(3, 6) → aSort(Sample[L_1, a, false]) → L_2Sequence(random(), k, 1, a) → L_3Sum(L_3) → bSum(L_4) → cShuffle(L_4) → L_5Flatten(Append[{"p(x)"}, L_5]) → L_7Flatten(Append[{"x"}, L_2]) → L_6TableText({L_6, L_7}, "c|h") → text1Sequence((Element[L_2, i] * Element[L_5, i]), i, 1, a) → L_8Sum(L_8) → dSequence(((Element[L_2, i] - d)^(2) * Element[L_5, i]), i, 1, a) → L_9Sequence(Text[Element[L_2, i]], i, 1, a) → L_{10}Join({Sequence["+", i, 1, a - 1], {""}}) → L_{12}Sequence("x", i, 1, 6) → L_{13}Sequence(Text[Element[L_5, i]], i, 1, a) → L_{11}Sequence("(" + (Element[L_{10}, i]) + ")(" + (Element[L_{11}, i]) + ")" + (Element[L_{12}, i]), i, 1, a) → L_{14}Sum(L_{14}) → text3Sequence("(" + (Element[L_{10}, i] - d) + ")²" + "(" + (Element[L_{11}, i]) + ")" + (Element[L_{12}, i]), i, 1, a) → L_{15}Sum(L_{15}) → text5
AI Drawing Prompt Reference
Display the distribution of a random variable by generating a sequence of 5 to 25 elements, randomly sampling and sorting a subset, assigning random probabilities, calculating the expected value and variance, and finally showing each element with its probability in a table, with a graphical representation of the distribution.
The prompt above was compiled from the original drawing commands and is for reference only.