
Expected Value and Geometry Interaction Demo
Loading the math board and drawing, please wait…
In collections
Statistics Games
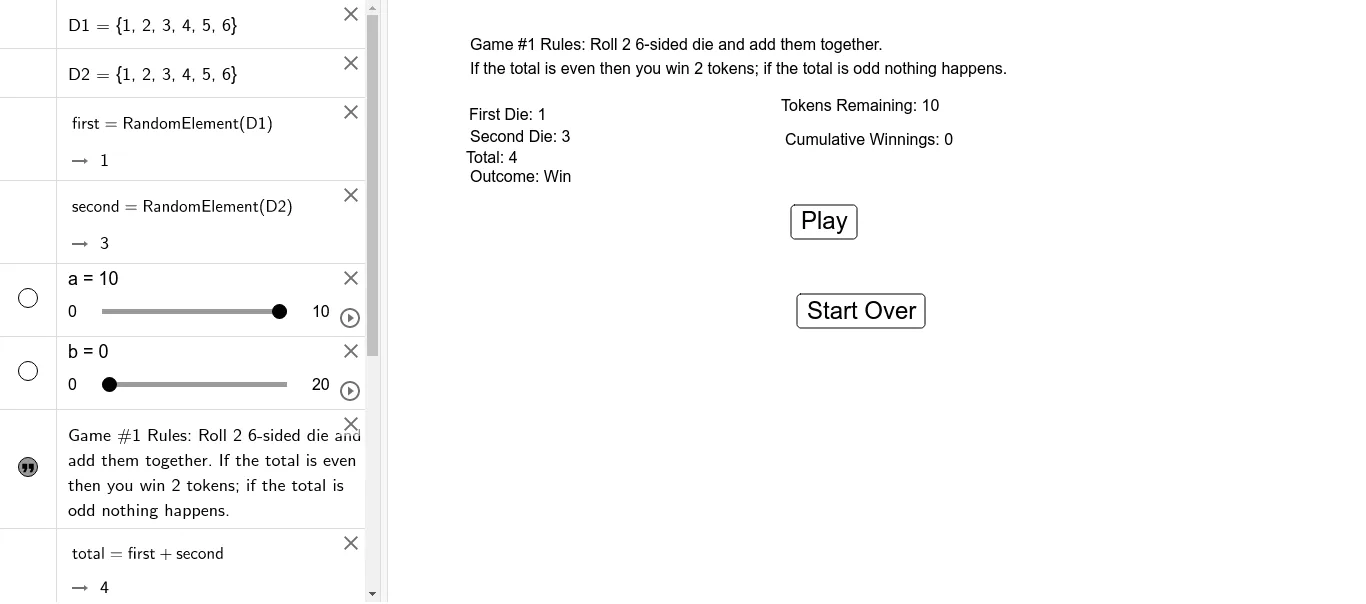
This example demonstrates the application of expected value calculations combined with geometric shapes (cylinder, line segment, prism) through interactive means; Core math concepts include expected value, hypergeometric distribution, and properties of geometric bodies; GeoGebra commands and objects like RandomElement (random element generation), If (conditional judgment), and objects D1-D8, text1-text8, button1-2 are used in construction; Suitable for high school and above mathematics teaching, for intuitive teaching and exploration of probability statistics and solid geometry.
GeoGebra Commands & Parameters
RandomElement(D1) → firstRandomElement(D2) → secondIf(Mod[total, 2] ≟ 0, "Win", "Lose") → text5
AI Drawing Prompt Reference
Create an interactive visual demonstrating the integration of probability statistics and geometric shapes, including randomly selected elements labeled 'first' and 'second', showing 'Win' or 'Lose' text based on whether a total count is even or odd, using geometric bodies like cylinders, line segments, and prisms to visualize expected value calculations and hypergeometric distributions, suitable for high school mathematics teaching to intuitively explore properties of probability statistics and solid geometry.
The prompt above was compiled from the original drawing commands and is for reference only.