
Linear Regression Inference 1
Loading the math board and drawing, please wait…
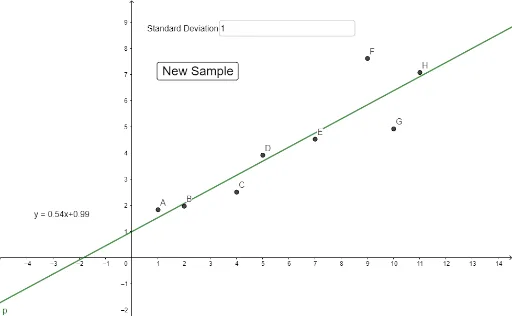
This example demonstrates the graphical process of parameter estimation and hypothesis testing in linear regression models. Key math concepts include linear regression equations, means, correlation coefficients, probability distributions, tree diagrams, spheres, and hyperbolas. Construction highlights involve using RandomNormal to generate normal distribution data, mean and stdev for calculating means and standard deviations, PMCC for correlation coefficient, and Textfield for displaying text. Objects like s, f, a, b are utilized to build the visualizations. Suitable for high school and above students to understand the application of statistical inference in regression analysis.
GeoGebra Commands & Parameters
RandomNormal(f(1), s) → aRandomNormal(f(2), s) → bRandomNormal(f(4), s) → cRandomNormal(f(5), s) → dRandomNormal(f(7), s) → eRandomNormal(f(9), s) → gRandomNormal(f(10), s) → hRandomNormal(f(11), s) → imean(l1) → jmean(l2) → kstdev(l1) → lstdev(l2) → mPMCC({A, B, C, D, E, F, G, H}) → nTextfield(s) → InputBox1
AI Drawing Prompt Reference
Generate a set of normal distribution data points using RandomNormal with means of 1, 2, 4, 5, 7, 9, 10, 11 and a common standard deviation. Calculate and display the mean and standard deviation for each set, then compute the correlation coefficient for all data points. Finally, use Textfield to show the generated dataset.
The prompt above was compiled from the original drawing commands and is for reference only.