
Exercise 4.8: Function Graphs
Loading the math board and drawing, please wait…
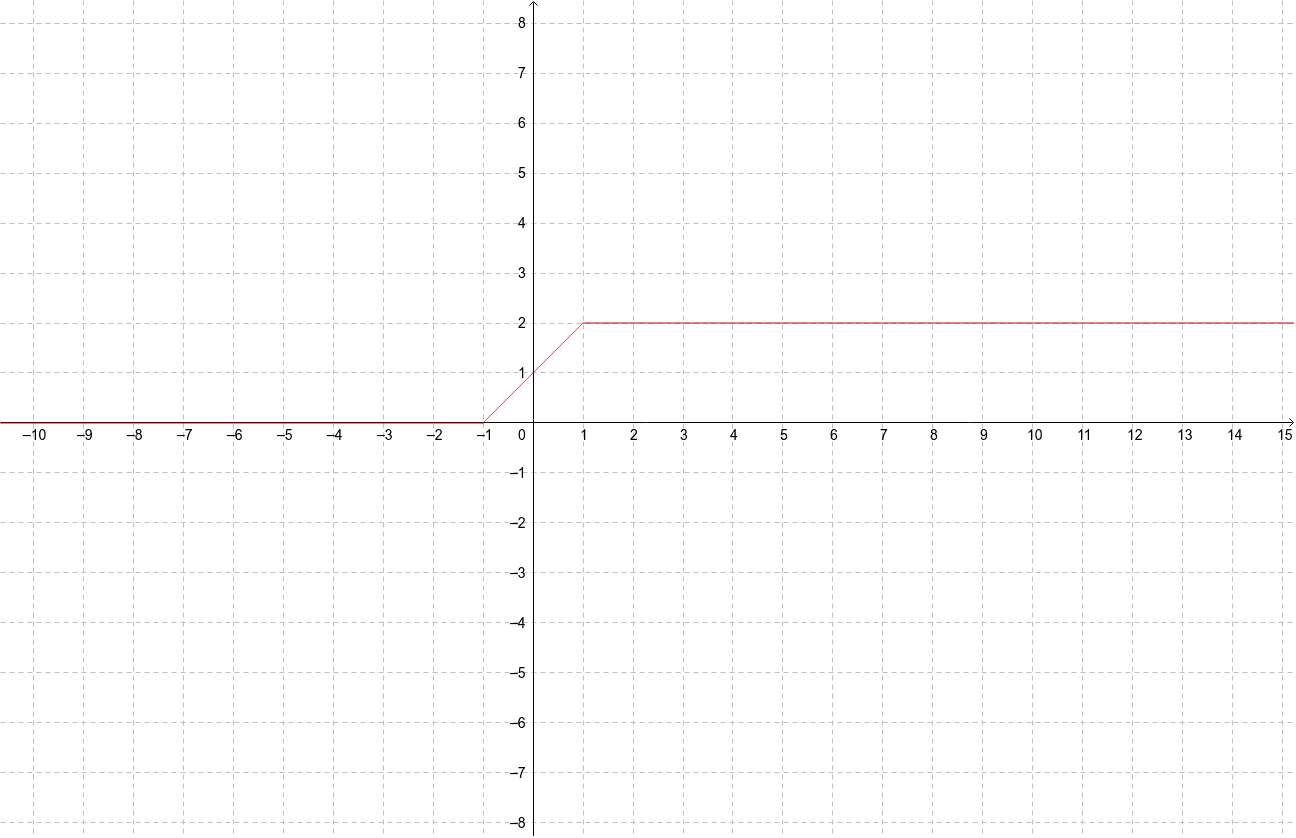
This example demonstrates the graphs of functions in exercise 4.8. The core mathematical concepts involved include the graphical representation of functions. The functions f, g, and h are constructed using the GeoGebra command Function. Suitable for high school mathematics education and learning.
GeoGebra Commands & Parameters
Function(0, -20, -1) → fFunction(1 + x, -1, 1) → gFunction(2, 1, 1000) → h