
Example of Using Correlation Coefficient to Describe Data Relationship
Loading the math board and drawing, please wait…
In collections
AP Statistics
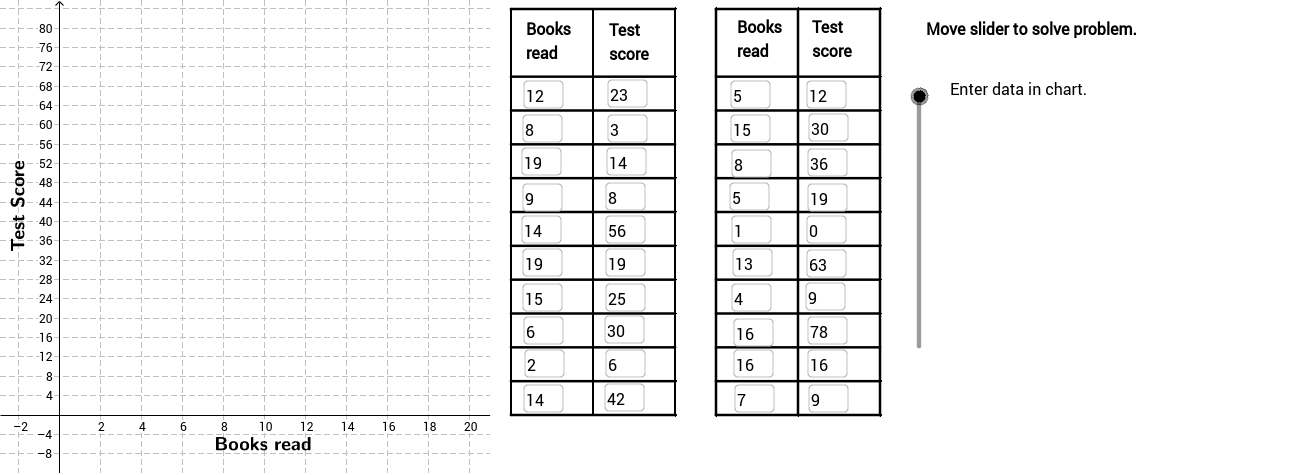
This example demonstrates how to use the correlation coefficient to describe the strength of the relationship between data. Key mathematical concepts include linear regression and data distribution analysis. Construction involves using GeoGebra commands like FitLineY and PMCC to create data relationship graphs. Suitable for high school students or college freshmen for learning statistical analysis basics.
GeoGebra Commands & Parameters
FitLineY(PointList1) → LineFitPMCC(PointList1) → CorCoeffTextfield(A2) → InA2Textfield(A3) → InA3Textfield(A4) → InA4Textfield(A5) → InA5Textfield(A6) → InA6Textfield(A7) → InA7Textfield(A8) → InA8Textfield(A9) → InA9Textfield(A10) → InA10Textfield(A11) → InA11Textfield(A12) → InA12Textfield(A13) → InA13Textfield(A14) → InA14Textfield(A15) → InA15Textfield(A16) → InA16Textfield(A17) → InA17Textfield(A18) → InA18Textfield(A19) → InA19Textfield(A20) → InA20Textfield(A21) → InA21Textfield(B2) → InB2Textfield(B3) → InB3Textfield(B4) → InB4Textfield(B5) → InB5Textfield(B6) → InB6Textfield(B7) → InB7Textfield(B8) → InB8Textfield(B9) → InB9Textfield(B10) → InB10Textfield(B11) → InB11Textfield(B12) → InB12Textfield(B13) → InB13Textfield(B14) → InB14Textfield(B15) → InB15Textfield(B16) → InB16Textfield(B17) → InB17Textfield(B18) → InB18Textfield(B19) → InB19Textfield(B20) → InB20Textfield(B21) → InB21Sequence(Segment[(22, 0 + 7 * i), (30, 0 + 7 * i)], i, 0, 10) → Linesh1Sequence(Segment[(32, 0 + 7 * i), (40, 0 + 7 * i)], i, 0, 10) → Linesh2Sequence(Segment[(22 + 4 * i, 0), (22 + 4 * i, 84)], i, 0, 2) → Linesv1Sequence(Segment[(32 + 4 * i, 0), (32 + 4 * i, 84)], i, 0, 2) → Linesv2Segment((22, 84), (30, 84)) → top1Segment((32, 84), (40, 84)) → top2If(LineVisible, "Hide Best Fit Line", "Show Best Fit Line") → LineButtonPolygon((21, y(Corner[1])), Corner[2], Corner[3], (21, y(Corner[4]))) → poly1, a, b, c, dRotateText("Test Score", 90*°) → SideLegendRotateText("Books read", 0) → BottomLegendIf(CorVisible, "Hide Correlation Coefficient", "Show Correlation Coefficient") → CorButton
AI Drawing Prompt Reference
Draw a data relationship graph showing how to use the correlation coefficient to describe the strength of data. Include two sets of data points, a line fitting these points for linear regression, and the correlation coefficient label. Add horizontal and vertical guide lines to divide the chart area into four parts, and connect the top boundaries.
The prompt above was compiled from the original drawing commands and is for reference only.