
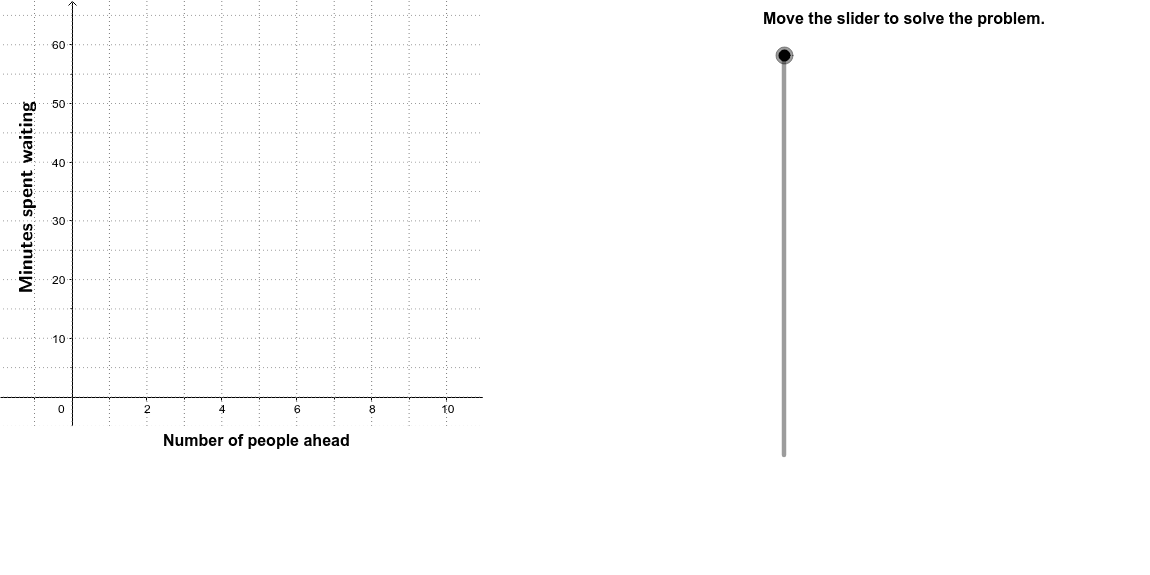
Example 2: Bank Queue Waiting Time vs. Number of People Ahead
Loading the math board and drawing, please wait…
In collections
CCSS IP Math I Unit 4 Lesson 3
This example demonstrates the relationship between a customer's waiting time in a bank queue and the number of people ahead when they entered. It involves core math concepts such as function graphs, scatter plots, and possibly parametric curves. The construction uses GeoGebra commands like Polygon for shapes, Textfield for labels, Line and Segment for drawing, Sequence for generating points, and RotateText for annotations. Objects include points P_2 and P_1, sliders for direction control, and arrays A1-A7, B1-B7 for data. It is suitable for high school math or statistics classes to teach data analysis and graphing.
GeoGebra Commands & Parameters
Polygon((11, y(Corner[2])), Corner[2], Corner[3], (11, y(Corner[4]))) → poly1, a, c, d, eTextfield(A1) → InA1Textfield(A2) → InA2Textfield(A3) → InA3Textfield(A4) → InA4Textfield(A5) → InA5Textfield(B1) → InB1Textfield(B2) → InB2Textfield(B3) → InB3Textfield(B4) → InB4Textfield(B5) → InB5Line(P_1, P_2) → gTextfield(A6) → InA6Textfield(A7) → InA7Textfield(B6) → InB6Textfield(B7) → InB7Sequence(Segment[(13.5, 13 + (6 * i)), (18, 13 + (6 * i))], i, 0, 7) → LinesHorSegment((13.5, 66), (18, 66)) → TopSegment((13.5, 13), (13.5, 66)) → Side1Segment((18, 13), (18, 66)) → Side2Segment((15.75, 13), (15.75, 66)) → MidLineSequence(x = i, i, -2, 11) → Hash1Sequence(y = (5 * i), i, -2, 13) → Hash2RotateText("Minutes spent waiting", 90*°) → SideLegand2Polygon((11, -5), (-2, -5), Corner[1], (11, y(Corner[1]))) → poly2, f, h, i, j