
Evaluating Quadratic Functions
Loading the math board and drawing, please wait…
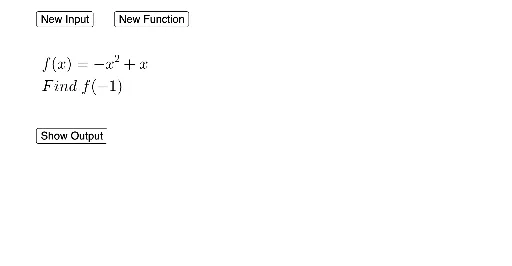
This example demonstrates how to dynamically evaluate and visualize quadratic functions using GeoGebra, involving concepts like quadratic functions, natural numbers, linear regression, polygons, area, and sine functions. Key GeoGebra commands and objects used include Random, RandomElement, Simplify, along with c, d, a, b, f, buttons, text elements, etc. It is suitable for high school mathematics education to help students understand the properties and graphing of quadratic functions.
GeoGebra Commands & Parameters
Random(-3, 3) → cRandom(-3, 3) → dRandomElement({-2, -1, 1, 2}) → bRandom(-3, 3) → XSimplify(f) → g
AI Drawing Prompt Reference
Create a dynamic visualization of a quadratic function using randomly generated coefficients c and d, and a random b value to define the function. Plot the function's graph on a coordinate system, and include a randomly chosen X value for calculating and displaying the function's output. Finally, simplify the computed results and display them on the graph.
The prompt above was compiled from the original drawing commands and is for reference only.