
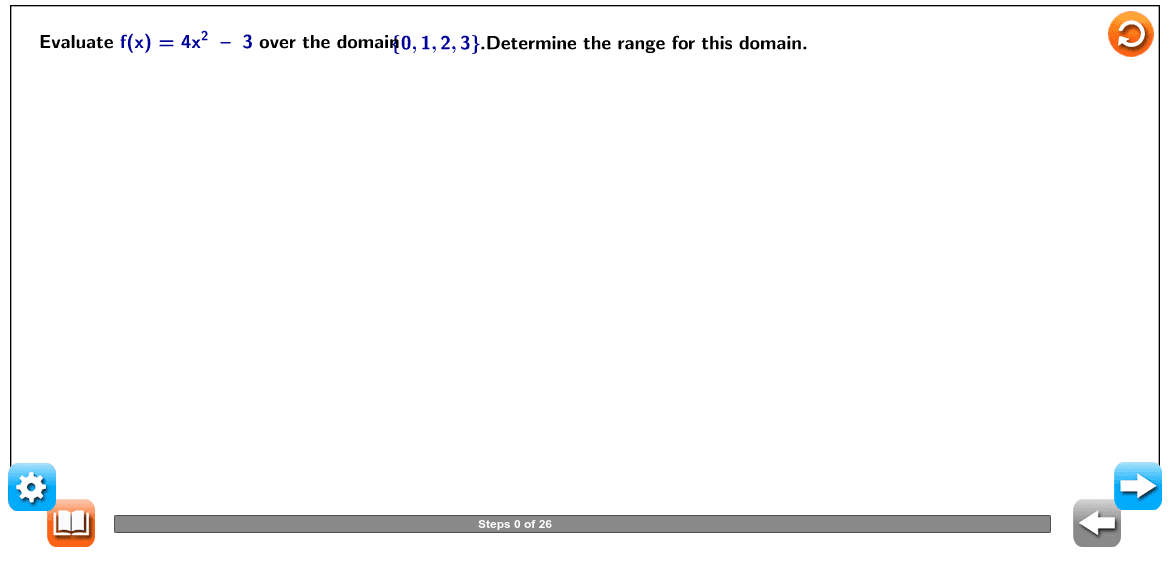
Evaluate f(x)=4x²-3 over a discrete domain and find its range
Loading the math board and drawing, please wait…
In collections
CCSS Support Math II Unit 2
This example demonstrates how to evaluate the quadratic function f(x)=4x²-3 over the discrete domain {0,1,2,3} and determine the corresponding range. The core mathematical concept is the relationship between a function's domain and range, specifically how a finite set of input values maps to output values for a quadratic expression. The construction uses GeoGebra commands such as Sequence to generate the domain points, LaTeX to display the function formula, Segment or Vector to visually connect inputs to outputs, and interactive elements like Next/Prev buttons or sliders to step through the evaluation process. This resource is suitable for middle or high school students learning basic function concepts, including function notation, tabular representation, and computing ranges for discrete domains. It also serves as an effective interactive classroom demonstration for reinforcing the idea of function mapping.
GeoGebra Commands & Parameters
Segment(A_0, B_0) → ScalelineSequence(Segment[A_0 + (i, 0), A_0 + (i, (-0.5))], i, 0, 10) → list1Sequence(Segment[A_0 + (i - 0.5, 0), A_0 + (i - 0.5, (-0.4))], i, 1, 10) → list2Sequence(Sequence[Segment[A_0 + ((0.5 * i) + (0.1 * j), 0), A_0 + ((0.5 * i) + (0.1 * j), (-0.3))], j, 1, 4], i, 0, 19) → list3LaTeX("\text{0}") → Scalevalue0LaTeX("\text{1}") → Scalevalue1LaTeX("\text{2}") → Scalevalue2LaTeX("\text{3}") → Scalevalue3LaTeX("\text{4}") → Scalevalue4LaTeX("\text{5}") → Scalevalue5LaTeX("\text{6}") → Scalevalue6LaTeX("\text{7}") → Scalevalue7LaTeX("\text{8}") → Scalevalue8LaTeX("\text{9}") → Scalevalue9LaTeX("\text{10}") → Scalevalue10Segment(D_0, (x(D_0), 0)) → jVector(C_0, D_0) → uLaTeX("\text{Evaluate the function for each of the domain values.") → text4LaTeX("\text{Given function}") → text11LaTeX("\text{Simplify.}") → text15LaTeX((((("\text{ \textcolor{#000099}{f(" * val0) * ") = ") * sub1) * "}}")) → text14LaTeX("\text{Given function}") → text11_1LaTeX("\text{Simplify.}") → text15_1LaTeX("\text{Given function}") → text11_2LaTeX("\text{Simplify.}") → text15_2LaTeX("\text{Given function}") → text11_3LaTeX("\text{Simplify.}") → text15_3LaTeX((((("\text{ \textcolor{#000099}{f(" * val2) * ") = ") * sub3) * "}}")) → text14_2LaTeX((((("\text{ \textcolor{#000099}{f(" * val3) * ") = ") * sub4) * "}}")) → text14_3LaTeX("\text{Determine the range of the function for the given domain.}") → text17LaTeX("\text{Therefore, the range of the function over the given domain is}") → text21Segment((0, 0), (0, 1.6)) → iSegment(F_0, (x(F_0), 0)) → kVector(E_0, F_0) → vLaTeX("\text{.Determine the range for this domain.}") → text3LaTeX((((("\text{ \textcolor{#000099}{f(" * val1) * ") = ") * sub2) * "}}")) → text14_1Factors(24) → factLaTeX((("\text{Constant=" * valuec) * "}")) → text23LaTeX((((("\text{Evaluate \textcolor{#000099}{f(x) = " * valuex) * "x² \;– \;") * valuec) * "} over the domain}")) → text1LaTeX((("\text{Evaluate \textcolor{#000099}{f(" * val0) * ")}.}")) → text9LaTeX((("\text{Evaluate \textcolor{#000099}{f(" * val1) * ")}.}")) → text9_1LaTeX((("\text{Evaluate \textcolor{#000099}{f(" * val2) * ")}.}")) → text9_2LaTeX((("\text{Substitute \textcolor{#000099}{" * val2) * "} for \textcolor{#000099}{x}.}")) → text13_2LaTeX((("\text{Evaluate \textcolor{#000099}{f(" * val3) * ")}.}")) → text9_3LaTeX((("\text{Substitute \textcolor{#000099}{" * val3) * "} for \textcolor{#000099}{x}.}")) → text13_3LaTeX("\text{values we substituted for \textcolor{#000099}{x}.}") → text19LaTeX((("\text{Substitute \textcolor{#000099}{" * val1) * "} for \textcolor{#000099}{x}.}")) → text13_1LaTeX("\text{\mathbf{Quadratic \;function} a function that can be written in the form \textcolor{#000099}{f(x) = ax² + bx + c}, }") → text24LaTeX("\text{where \textcolor{#000099}{a ≠ 0}. The graph of any quadratic function is a parabola.}") → text25LaTeX("\text{ function.}") → text27LaTeX("\text{ function.}") → text29LaTeX((("\text{Substitute \textcolor{#000099}{" * val0) * "} for \textcolor{#000099}{x}.}")) → text13LaTeX((("\text{Coefficient of x=" * valuex) * "}")) → text2LaTeX("\text{ \mathbf{Domain} the set of all inputs of a function; the set of \textcolor{#000099}{x}-values that are valid for the}") → text26LaTeX("\text{\mathbf{Range} the set of all outputs of a function; the set of \textcolor{#000099}{y}-values that are valid for the }") → text28LaTeX((("\text{\textcolor{#000099}{" * sub1) * "}.}")) → text30LaTeX("\text{The outputs from the previous step were}") → text20LaTeX((((("\text{To evaluate the function \textcolor{#000099}{f(x) = " * valuex) * "x² -") * valuec) * "} over the domain")) → text5LaTeX((((("\text{into \textcolor{#000099}{f(x) = " * valuex) * "x²-") * valuec) * "}.")) → text8LaTeX((((("\text{ \textcolor{#000099}{f(x) = " * valuex) * "x²-") * valuec) * "}}")) → text10LaTeX((((((((("\text{ \textcolor{#000099}{f(" * val0) * ") = ") * valuex) * "(") * val0) * ")²-") * valuec) * "}}")) → text12LaTeX((((("\text{ \textcolor{#000099}{f(x) = " * valuex) * "x²-") * valuec) * "}}")) → text10_1LaTeX((((((((("\text{ \textcolor{#000099}{f(" * val1) * ") = ") * valuex) * "(") * val1) * ")² -") * valuec) * "}}")) → text12_1LaTeX((((("\text{ \textcolor{#000099}{f(x) = " * valuex) * "x²-") * valuec) * "}}")) → text10_2LaTeX((((((((("\text{ \textcolor{#000099}{f(" * val2) * ") = ") * valuex) * "(") * val2) * ")²-") * valuec) * "}}")) → text12_2LaTeX((((("\text{ \textcolor{#000099}{f(x) = " * valuex) * "x²-") * valuec) * "}}")) → text10_3LaTeX((((((((("\text{ \textcolor{#000099}{f(" * val3) * ") = ") * valuex) * "(") * val3) * ")²-") * valuec) * "}}")) → text12_3LaTeX("\text{, substitute the values from the domain") → text7LaTeX((((("\text{When \textcolor{#000099}{" * val0) * "} is substituted for \textcolor{#000099}{x},the value of \textcolor{#000099}{f(") * val0) * ")} is}")) → text16LaTeX((((((("\text{When \textcolor{#000099}{" * val1) * "} is substituted for \textcolor{#000099}{x},the value of \textcolor{#000099}{f(") * val1) * ")} is \textcolor{#000099}{") * sub2) * "}.}")) → text16_1LaTeX((((((("\text{When \textcolor{#000099}{" * val2) * "} is substituted for \textcolor{#000099}{x},the value of \textcolor{#000099}{f(") * val2) * ")} is \textcolor{#000099}{") * sub3) * "}.}")) → text16_2LaTeX((((((("\text{When \textcolor{#000099}{" * val3) * "} is substituted for \textcolor{#000099}{x},the value of \textcolor{#000099}{f(") * val3) * ")} is \textcolor{#000099}{") * sub4) * "}.}")) → text16_3LaTeX((((((((("\text{\textcolor{#000099}{" * sub1) * ", ") * sub2) * ",") * sub3) * ", and \; ") * sub4) * "}.}")) → text31LaTeX("\text{Collect the set of outputs for the inputs.Recall that the outputs are the \textcolor{#000099}{f(x)} values,and the inputs are the}") → text18
AI Drawing Prompt Reference
Draw the graph of the quadratic function f(x)=4x²-3 over the discrete domain {0,1,2,3}, showing the mapping from input values to output values. Start by marking the points 0 to 10 on the x-axis and labeling them. Then, for each input value, draw line segments connecting the input points to their corresponding function output points to form the function graph. Finally, label the function expression and highlight the set of function values, which is the range of the function over the given domain.
The prompt above was compiled from the original drawing commands and is for reference only.