
Euler's Method Demo
Loading the math board and drawing, please wait…
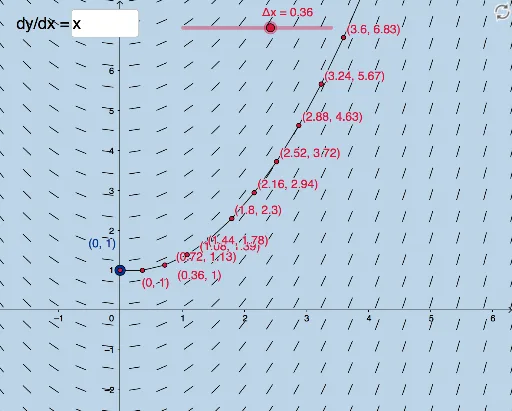
This example demonstrates Euler's method for numerically approximating solutions to differential equations by drawing line segments that converge to the solution curve. Key math concepts include differential equations, numerical methods, function graphing, and line segment construction. It utilizes GeoGebra commands like SlopeField, Textfield, and Segment. Suitable for high school and above students to learn and visualize numerical solutions to differential equations, ideal for teaching demonstrations and concept visualization.
GeoGebra Commands & Parameters
SlopeField(f, 20) → slopefield1Textfield(f) → InputBox1Segment(A, C) → gSegment(C, D) → hSegment(D, E) → iSegment(E, F) → jSegment(F, G) → kSegment(G, H) → lSegment(H, I) → mSegment(I, J) → nSegment(J, K) → pSegment(K, L) → qSegment(L, M) → rSegment(M, N) → sSegment(N, O) → tSegment(O, P) → aSegment(P, Q) → bSegment(Q, R) → cSegment(R, S) → dSegment(S, T) → eSegment(T, U) → f_1Segment(U, V) → g_1
AI Drawing Prompt Reference
Create a visual demonstration of Euler's method for numerically approximating solutions to differential equations by drawing line segments that converge to a solution curve. Begin with a slope field representing the differential equation, then sequentially draw multiple small line segments connecting points based on the input function values, starting from an initial point and connecting successively, forming a path that gradually approaches the theoretical solution curve to illustrate the convergence of the numerical method.
The prompt above was compiled from the original drawing commands and is for reference only.