
Estimating the Graph of the Derivative Function
Loading the math board and drawing, please wait…
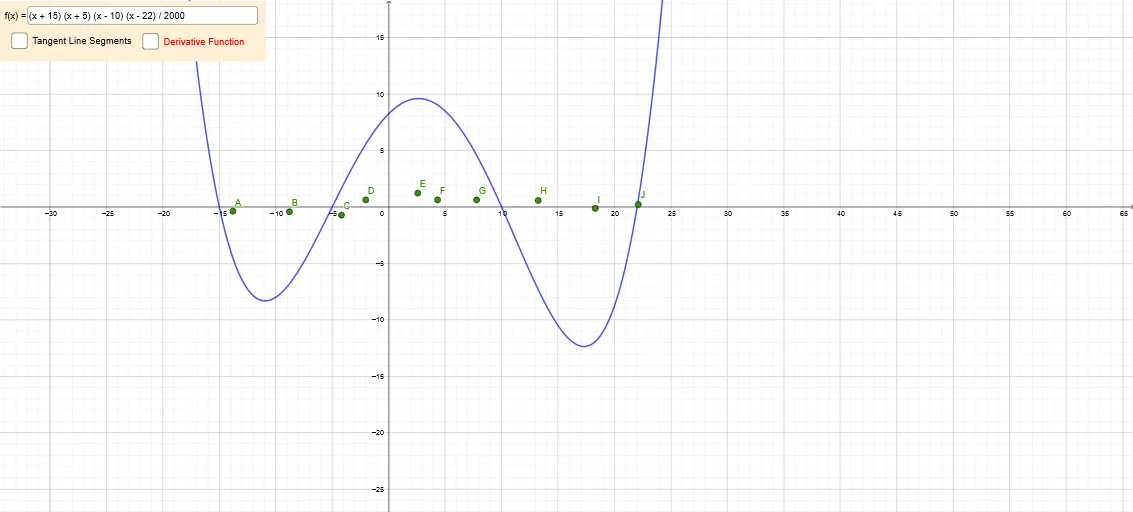
This example shows how to estimate the graph of the derivative function f′ for a given function f using numerical methods. Users can input a function expression and use interactive input boxes and sliders to select interval endpoints A and B, then compute the slope of the secant line to approximate the instantaneous rate of change (derivative) at various points. The core mathematical concepts include the definition of a derivative, the relationship between secant and tangent lines, the idea of limits, and the geometric meaning of the derivative function. The GeoGebra construction employs Textfield, Segment commands and objects such as f, f′, A, B, etc., to draw secant lines and dynamically update slope displays. Learners can observe how the original function’s graph corresponds to its derivative’s graph, deepening their understanding of fundamental calculus concepts. This example is suitable for high‑school or first‑year university calculus courses and serves as an interactive tool for exploring derivative graphs.
GeoGebra Commands & Parameters
Textfield(f) → InputBox1Segment((x(A) - 0.5, f(x(A)) - f'(x(A)) / 2), (x(A) + 0.5, f(x(A)) + f'(x(A)) / 2)) → hSegment((x(B) - 0.5, f(x(B)) - f'(x(B)) / 2), (x(B) + 0.5, f(x(B)) + f'(x(B)) / 2)) → iSegment((x(C) - 0.5, f(x(C)) - f'(x(C)) / 2), (x(C) + 0.5, f(x(C)) + f'(x(C)) / 2)) → jSegment((x(D) - 0.5, f(x(D)) - f'(x(D)) / 2), (x(D) + 0.5, f(x(D)) + f'(x(D)) / 2)) → kSegment((x(E) - 0.5, f(x(E)) - f'(x(E)) / 2), (x(E) + 0.5, f(x(E)) + f'(x(E)) / 2)) → lSegment((x(F) - 0.5, f(x(F)) - f'(x(F)) / 2), (x(F) + 0.5, f(x(F)) + f'(x(F)) / 2)) → mSegment((x(G) - 0.5, f(x(G)) - f'(x(G)) / 2), (x(G) + 0.5, f(x(G)) + f'(x(G)) / 2)) → nSegment((x(H) - 0.5, f(x(H)) - f'(x(H)) / 2), (x(H) + 0.5, f(x(H)) + f'(x(H)) / 2)) → pSegment((x(I) - 0.5, f(x(I)) - f'(x(I)) / 2), (x(I) + 0.5, f(x(I)) + f'(x(I)) / 2)) → qSegment((x(J) - 0.5, f(x(J)) - f'(x(J)) / 2), (x(J) + 0.5, f(x(J)) + f'(x(J)) / 2)) → r
AI Drawing Prompt Reference
Draw an interactive plot with an input box for a user‑defined function f(x). Plot the function curve, then place ten points along the curve and at each point draw a short segment of horizontal length 1 centered on the point, with slope equal to the derivative at that point, giving a visual approximation of the derivative graph clearly showing the relationship between the function and its derivative.
The prompt above was compiled from the original drawing commands and is for reference only.