
Estimating New Mean
Loading the math board and drawing, please wait…
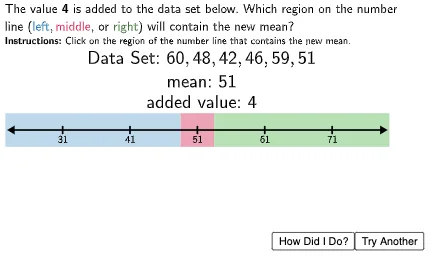
This example demonstrates how to dynamically adjust a dataset and estimate its new mean. Key math concepts include mean calculation, dataset transformation, and the application of indefinite integrals. Construction highlights involve using GeoGebra commands like mean, Join, Segment, and Polygon. Suitable for high school mathematics education, illustrating the integration of data statistics and geometric representation.
GeoGebra Commands & Parameters
mean(OrigList) → meanJoin({OrigList, {newval}}) → NewListmean(NewList) → newmeanSegment((0, 4.5), (11, 4.5)) → NumLinePolygon((-0.2, 5), (5, 5), (5, 4), (-0.2, 4)) → Box1, f, g, h, iPolygon((6, 5), (11.2, 5), (11.2, 4), (6, 4)) → Box3, n, p, q, rPolygon((6, 5), (5, 5), (5, 4), (6, 4)) → Box2, j, k, l, mSegment((1.5, 4.6), (1.5, 4.4)) → Tick1Segment((3.5, 4.6), (3.5, 4.4)) → Tick2Segment((5.5, 4.6), (5.5, 4.4)) → Tick3Segment((7.5, 4.6), (7.5, 4.4)) → Tick4Segment((9.5, 4.6), (9.5, 4.4)) → Tick5
AI Drawing Prompt Reference
Draw a horizontal line segment at y=4.5 with a length of 11 units. Below the line segment, create a rectangle divided into three parts: two smaller rectangles on the left and right, and a larger rectangle in the middle. Add a small vertical line segment above each smaller rectangle as a tick mark.
The prompt above was compiled from the original drawing commands and is for reference only.