
Estimating Gas Mileage: Linear Functions and Scatter Plot
Loading the math board and drawing, please wait…
In collections
CCSS IP Math I Unit 4 Lesson 2
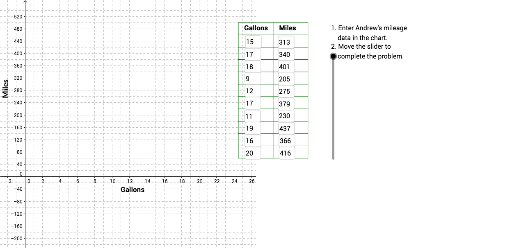
This GeoGebra example demonstrates how to estimate vehicle gas mileage (miles per gallon) by plotting recorded gallons of gas against total miles traveled and fitting a linear model to the data. It covers core algebra concepts including linear equations, linear functions, scatter plots, and coordinate geometry. The construction uses GeoGebra commands such as Corner, Polygon, Textfield, Sequence, Point, Line, and VerticalText, together with objects like Corn1–Corn4, poly1, Slid, and point pairs A1 through B11 to build an interactive coordinate interface. Suitable for middle school algebra and high school function instruction, it supports linear modeling, data trend analysis, and dynamic classroom demonstration.
GeoGebra Commands & Parameters
Corner(2) → Corn2Corner(3) → Corn3Polygon(Corn1, Corn2, Corn3, Corn4) → poly1, corn1, corn2, corn3, corn4Textfield(A2) → InA2Textfield(A3) → InA3Textfield(A4) → InA4Textfield(A5) → InA5Textfield(A6) → InA6Textfield(A7) → InA7Textfield(A8) → InA8Textfield(A9) → InA9Textfield(A10) → InA10Textfield(A11) → InA11Textfield(B11) → InB11Textfield(B10) → InB10Textfield(B9) → InB9Textfield(B8) → InB8Textfield(B7) → InB7Textfield(B6) → InB6Textfield(B5) → InB5Textfield(B4) → InB4Textfield(B3) → InB3Textfield(B2) → InB2Sequence(Segment[(24.5, 60 + (40 * j)), (32.5, 60 + (40 * j))], j, 0, 11) → LnListSequence(Segment[(24.5 + (4 * j), 60), (24.5 + (4 * j), 500)], j, 0, 2) → LnList2Point(a) → mpg10Line((0, 0), mpg10) → Lmpg10Line((0, 0), mpg22) → Lmpg22VerticalText("Miles") → LabelMiles
AI Drawing Prompt Reference
Draw a coordinate system with the x-axis representing gallons and the y-axis representing miles. Draw dashed lines for 10 miles per gallon and 22 miles per gallon. Mark the x-axis with 0 to 11 intervals, each representing 4 gallons. Mark the y-axis with 0 to 500 intervals, each representing 40 miles. Add a vertical text 'Miles' on the y-axis.
The prompt above was compiled from the original drawing commands and is for reference only.