
Estimating Area Under a Curve with 'n' Rectangles
Loading the math board and drawing, please wait…
In collections
Rate & Accumulation Yr 4 Much&Fast
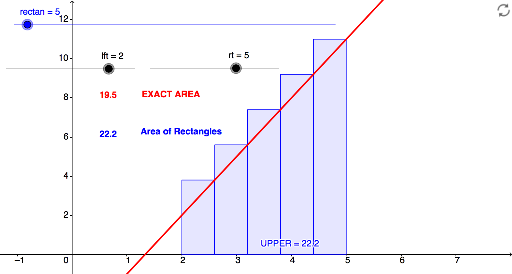
This example demonstrates how to estimate the area under a curve by using 'n' rectangles. It involves core mathematical concepts such as integral, left sum, trapezoidal sum, and upper sum. The construction uses GeoGebra commands like Integral, LeftSum, TrapezoidalSum, UpperSum, and Text. It is suitable for high school and above students studying calculus, helping them understand the geometric meaning of definite integrals and numerical approximation methods.
GeoGebra Commands & Parameters
Integral(f, lft, rt) → ExactLeftSum(f, lft, rt, rectan) → LOWerTrapezoidalSum(f, lft, rt, rectan) → TrapzUpperSum(f, lft, rt, rectan) → UPPERText(UPPER) → text1Text(Exact, (0.5, 8)) → text2
AI Drawing Prompt Reference
Draw a function graph and display its integral area. Below the graph, draw three types of rectangles with different numbers to represent left sum, trapezoidal sum, and upper sum, distinguished by colors. Label the approximate values of each sum method and the exact integral value at appropriate positions.
The prompt above was compiled from the original drawing commands and is for reference only.