
Equivalent Sine and Cosine Graphs
Loading the math board and drawing, please wait…
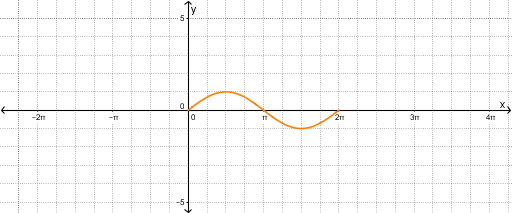
This example demonstrates the equivalence and transformation relationship between sine and cosine function graphs. It involves core math concepts like trigonometric functions, periodicity, phase difference, parametric equations, and coordinate geometry. GeoGebra commands and objects used include If statements, LaTeX for formulas, Slider Animation, Parametric Equation, and Locus. Suitable for high school mathematics teaching to help students understand trigonometric function graph transformations and the impact of parameters on function graphs.
GeoGebra Commands & Parameters
If(abs(j) ≟ 4, Text[π], text10) → text11LaTeX(f, true, true) → text1If(a < 0, "-", "") → signAIf(k < 0, "-", "") → signKIf(c > 0, "-", "+") → signCIf(c ≟ 0, "", signC) → text3If(c ≟ 0, "", text11) → text7If(absA ≟ 1, "", Text[absA]) → text6If(k ≟ 0, "", Text[absK]) → text5If(a < 0, "-", "") → signA_1If(k < 0, "-", "") → signK_1If(c > 0, "-", "+") → signC_1If(c ≟ 0, "", signC_1) → text3_1If(absA_1 ≟ 1, "", Text[absA_1]) → text6_1If(c ≟ 0, "", Text[absC_1]) → text7_1If(k < 0, "(", "") → text12If(k < 0, ")", "") → text13If((k < 0) ∧ c ≟ 0, "", "(") → text14If((k < 0) ∧ c ≟ 0, "", ")") → text15