
Equilateral Triangle and Normal Distribution Visualization
Loading the math board and drawing, please wait…
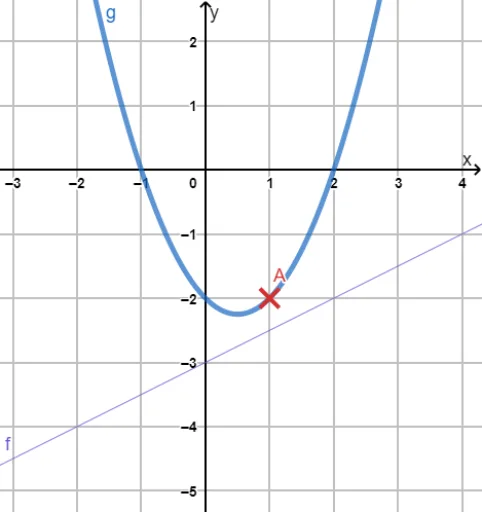
This example demonstrates the geometric relationship between equilateral triangles and normal distributions using GeoGebra. Key mathematical concepts include function graphs, properties of equilateral triangles, normal distribution curves, and standard deviation. Construction involves using function object f, geometric object g, parameter n, and point A. Suitable for high school students learning geometric and probabilistic statistics integration, applicable in mathematical modeling and visualization teaching.
GeoGebra Commands & Parameters
y = (0.5 * x) - 3g(x) = x^(2) - x - 2Numeric n(1)(n, g(n))
AI Drawing Prompt Reference
Draw a combined figure of an equilateral triangle and a normal distribution curve. Place the triangle on the left and the curve on the right. Align the height of the triangle with the peak of the curve. The width of the curve is determined by the standard deviation. Ensure the figure is clear and proportions are coordinated, suitable for teaching.
The prompt above was compiled from the original drawing commands and is for reference only.