
Equation of a Straight Line by Mathguru
Loading the math board and drawing, please wait…
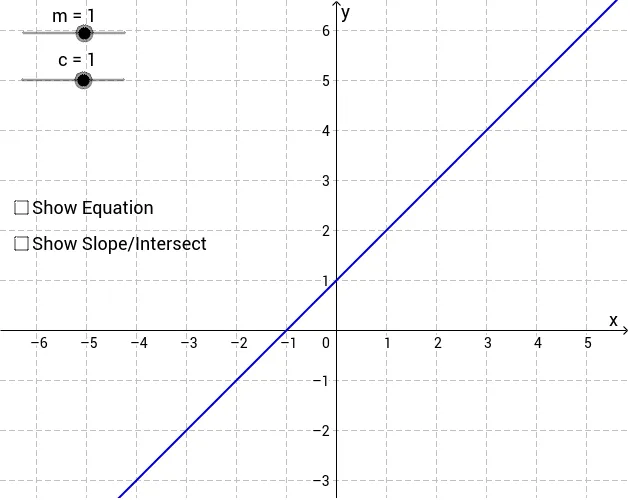
This example demonstrates the graphical representation of the straight line equation y=mx+c, allowing dynamic adjustment of slope m and y-intercept c to observe line variations. Core mathematical concepts include linear equations, slope, y-intercept, and coordinate geometry. GeoGebra commands like Segment, Point, and Vector are used, along with parameters c and m. Suitable for high school mathematics education to understand the geometric meaning and parameter effects of linear equations.
GeoGebra Commands & Parameters
Segment(A, C) → gSegment(C, B) → hPoint(f) → DVector(E, D) → u
AI Drawing Prompt Reference
Draw a straight line representing the equation y=mx+c with adjustable slope m and y-intercept c to observe variations. Include a point on the line, a vector starting from this point, and two line segments forming the line. Start by drawing the line, then mark the point, draw the vector, and finally connect the point to form segments.
The prompt above was compiled from the original drawing commands and is for reference only.