
Ellipse: Graphing
Loading the math board and drawing, please wait…
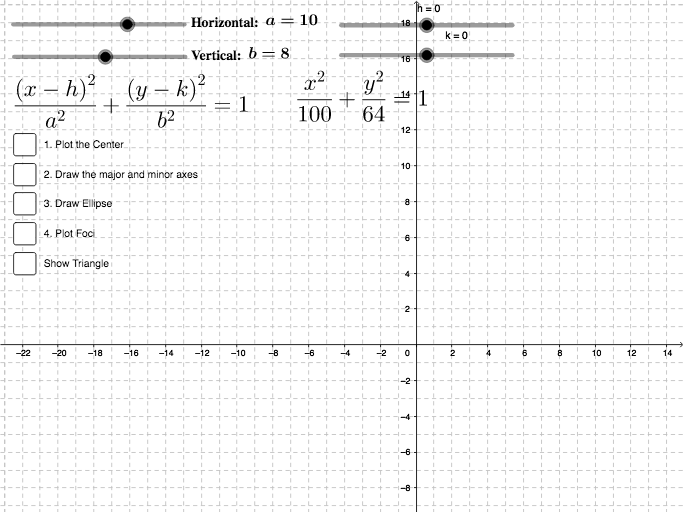
This example demonstrates how to graph an ellipse using GeoGebra. Key mathematical concepts include the definition and properties of an ellipse. Commands such as `If`, `Focus`, `Polygon`, and `RotateText` are used to construct the ellipse. Suitable for high school mathematics education and learning about ellipses.
GeoGebra Commands & Parameters
If(a > b, (h, b + k), (a + h, k)) → V_3Focus(p) → F_1, F_2Polygon((h, k), F_2, V_3) → poly1, d, e, gRotateText(text7, 1.5708) → text2CurveCartesian((a * cos(t)) + h, (b * sin(t)) + k, t, 0, k_1) → fIf(a > b, ((-a) + h, k), (h, (-b) + k)) → V_1If(a > b, (a + h, k), (h, b + k)) → V_2If(a > b, (h, (-b) + k), ((-a) + h, k)) → V_4Segment((h, k - (i * b)), (h, k + (i * b))) → a_1Segment((((-j) * a) + h, k), ((j * a) + h, k)) → b_1Angle(F_2, (h, k), V_3) → α
AI Drawing Prompt Reference
Draw an ellipse, showing its foci and definition. Start by plotting the center and major/minor axes, then connect the foci to points on the ellipse to form auxiliary shapes. Next, use a parametric equation to plot the ellipse curve, labeling the foci and center. Finally, add text annotations to explain the definition and properties of the ellipse for clarity.
The prompt above was compiled from the original drawing commands and is for reference only.