
Eight-Point Model with Two Degrees of Freedom on a Sphere
Loading the math board and drawing, please wait…
In collections
₉Extreme Verteilung der 8 Punkten auf der Kugel
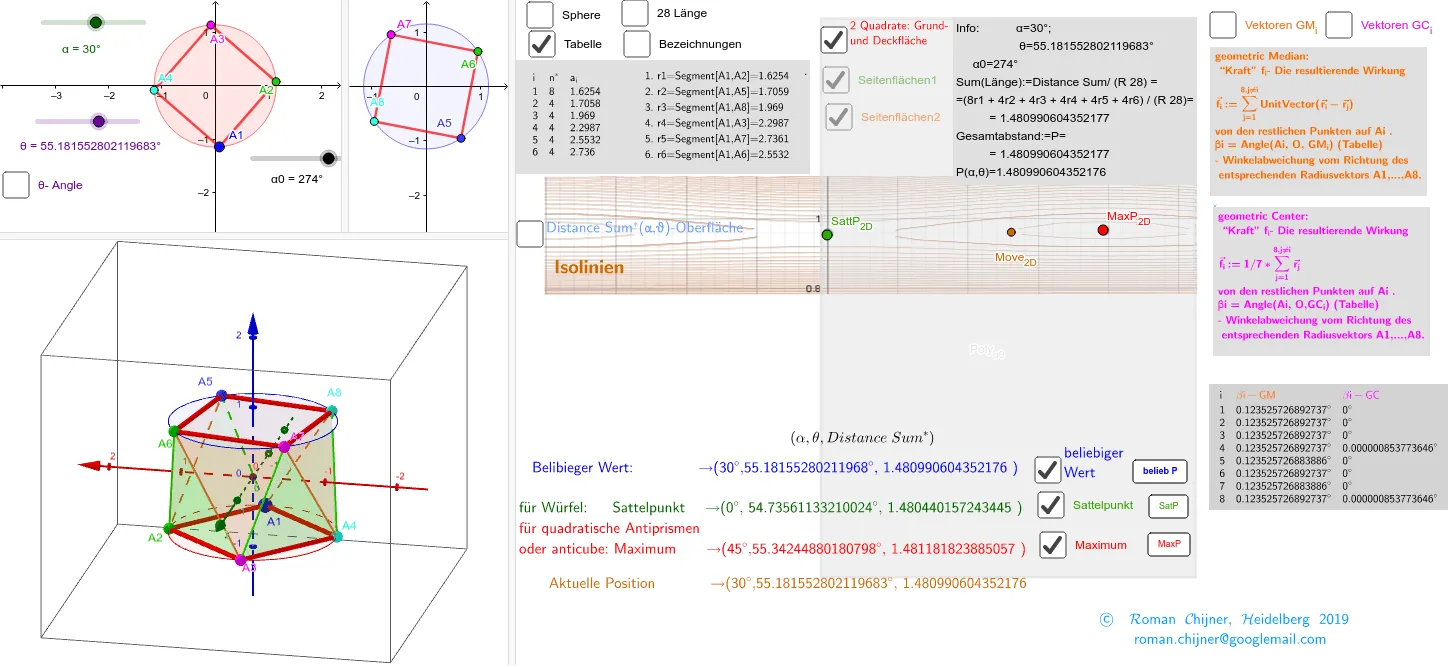
This example demonstrates the construction of an eight-point model with two degrees of freedom on a spherical surface. It involves core mathematical concepts such as vectors, coordinate geometry, solid geometry, calculus, and optimization problems. The construction utilizes GeoGebra commands and objects like Sphere, Circle, Translate, Ray, Segment, PolyLine, Zip, UnicodeToLetter, Point, Angle, Plane, Function, Sort, Unique, Polygon, Sequence, TableText, and LaTeX. It is suitable for high school and above learners studying spatial geometry and computational geometry applications.
GeoGebra Commands & Parameters
Sphere(O, R) → aCircle(O, r, xOyPlane) → c02Translate(A01, Vector[(0, 0, (-h))]) → A1Translate(A02, Vector[(0, 0, (-h))]) → A2Translate(A03, Vector[(0, 0, (-h))]) → A3Translate(A04, Vector[(0, 0, (-h))]) → A4Translate((r; α_1), Vector[(0, 0, h)]) → A5Translate((r; α_1 + 90°), Vector[(0, 0, h)]) → A6Translate((r; α_1 + 180°), Vector[(0, 0, h)]) → A7Translate((r; α_1 + 270°), Vector[(0, 0, h)]) → A8Ray(O, A1) → g1Segment(A1, A2) → seg12Segment(A1, A6) → seg16Segment(A1, A8) → seg18Segment(A1, A3) → seg13Segment(A1, A5) → seg15Segment(A1, A7) → seg17Segment(A2, A5) → seg25PolyLine(A1, A2, A3, A4, A1) → Poly2PolyLine(A5, A6, A7, A8, A5) → Poly1PolyLine({A1, A5, A2, A6, A3, A7, A4, A8, A1}) → Poly3Zip((A1 + a) / 2, a, {A2, A5, A8, A3, A7, A6}) → l6UnicodeToLetter(34) → u34Point(c1) → DAngle((0, 0, R), O, D) → δSegment(O, D) → seg0Plane(z = 1.480440157243445) → Pl_{Lö1}Plane(z = 1.481181823885057) → Pl_{Lö2}Function(P(u, v), u, -1°, 60°, v, -1°, 90°) → mPlane(z = h) → OberePolyLine(A01, A02, A03, A04, A01) → Poly02Zip(Segment[A1, a], a, {A2, A5, A8, A3, A7, A6}) → l5Sort(Join[Sequence[Sequence[Segment[lA(i), lA(j)], j, i + 1, 8], i, 1, 8]]) → LängeUnique(Zip[floor((a * 10000)) / 10000, a, Länge]) → Länge0Polygon({(-1°, -1°), (60°, -1°), (60°, 90°), (-1°, 90°), (-1°, -1°)}) → Poly_{αθ}Sequence(Sum[Sequence[If[abs(Länge0(i) - Länge(k)) < 0.01, 1, 0], k, 1, 28]], i, 1, Length[Länge0]) → m2TableText(Append["i", 1…Length[Länge0]], Append["n^*", m2], Append["a_i", Länge0], "v") → text8aZip(Ray[O, a], a, lA) → lRSequence((0, 0, 0) + ((1.5 * R) * UnitVector[Sum[Zip[UnitVector[lA(i) - a], a, lA \ {lA(i)}]]]), i, 1, 8) → lBZip(Vector[a, b], a, lA, b, lB) → lUZip(Text[a, P, true, true], P, l6, a, 1…8) → l7LaTeX(seg16, true, true) → text8Zip(Angle[a, O, b], a, lA, b, lB) → lβSequence((0, 0, 0) - ((1.5 * R) * UnitVector[(1 / 7 * Sum[lA \ {lA(i)}])]), i, 1, 8) → lGCZip(Angle[a, O, b], a, lA, b, lGC) → lβGZSequence(Vector[lA(i), lGC(i)], i, 1, 8) → lUGZ1TableText(Append["i", 1…8], Append["\fgcolor{orange}{βi-GM}", lβ], Append["\fgcolor{magenta}{βi-GC}", lβGZ], "v") → text4
AI Drawing Prompt Reference
Draw an eight-point model with two degrees of freedom on a sphere. Start by sketching a sphere and a circle on its surface. Translate points on the circle vertically to get eight points. Connect these points to form two pentagons and one octagon. Then, draw segments between specific pairs of points to create intricate geometric shapes. Label angles and lengths, and differentiate key segments with colors.
The prompt above was compiled from the original drawing commands and is for reference only.