
Dynamic Scattergraph: Observing Regression Line and Correlation Coefficient Chan
Loading the math board and drawing, please wait…
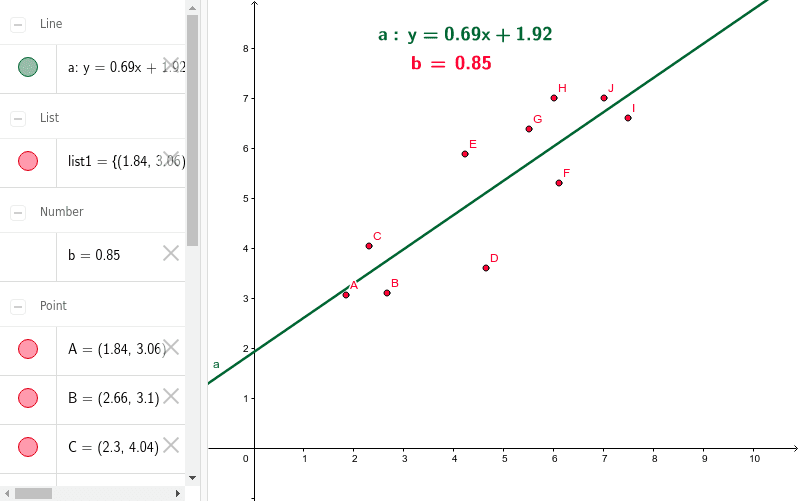
This example demonstrates how moving points in a scatter plot affects the regression line and correlation coefficient. Key mathematical concepts include linear regression, correlation coefficient, and the impact of data points on trends. Construction involves GeoGebra commands like FitLineY, LaTeX, and PMCC, using lists and slider animations for interactivity. Suitable for middle or high school mathematics education to understand data visualization and statistical analysis fundamentals.
GeoGebra Commands & Parameters
FitLineY(list1) → aLaTeX(a, true, true) → text1PMCC(list1) → bLaTeX(b, true, true) → text2
AI Drawing Prompt Reference
Create a dynamic scatter plot with draggable data points, a fitted regression line, and two text labels: one showing the regression equation in LaTeX format, and the other showing the Pearson correlation coefficient in LaTeX format. As users drag any point, the line and coefficient update in real time to illustrate how data changes affect the trend. Include axes, scatter points, the line, and the two labels, arranged clearly for educational demonstration.
The prompt above was compiled from the original drawing commands and is for reference only.