
Dynamic Illustration of Plotting Points (x,y) by Tim Brzezinski
Loading the math board and drawing, please wait…
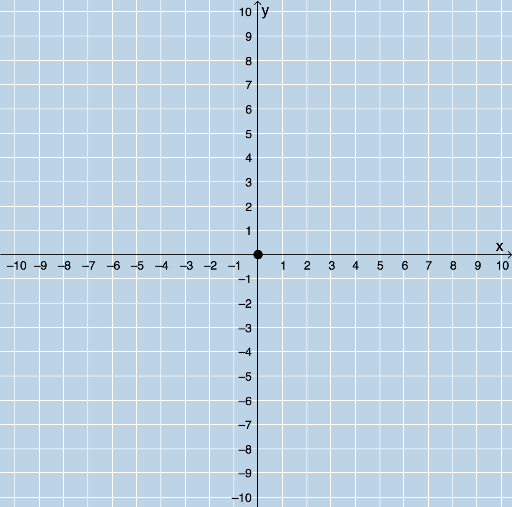
This example dynamically illustrates the process of plotting points (x,y) in the coordinate plane. It involves core math concepts like coordinate geometry, vector operations, and distance calculations. Key GeoGebra commands used in its construction include Random, Intersect, Dilate, Vector, and Distance. Suitable for middle school students and above learning coordinate geometry or for teaching demonstrations on point representation and transformations.
GeoGebra Commands & Parameters
Random(-10, 10) → aRandom(-10, 10) → bIntersect(f, g) → CIntersect(f, h) → DDilate(A, If[0 < e ≤ 1, 1 - e, 0], C) → A'Vector(E, A') → uDistance(E, C) → distanceECDistance(A, C) → distanceACDilate(C, If[1 < e ≤ 2, 2 - e, 0], D) → C'Vector(C, C') → vIntersect(g, xAxis) → FIntersect(f, g) → GDistance(G, D) → distanceGD
AI Drawing Prompt Reference
Dynamically illustrate the process of plotting points (x,y) in a coordinate plane, involving two randomly generated points, intersections with other points and lines to determine key positions, vector representation for direction, and distance calculations for scaling transformations, showing point representation and transformation relationships, suitable for teaching geometric constructions and coordinate geometry concepts.
The prompt above was compiled from the original drawing commands and is for reference only.