
Dynamic Exploration of Sine Function Graph y = a·sin(bx) with Adjustable Paramet
Loading the math board and drawing, please wait…
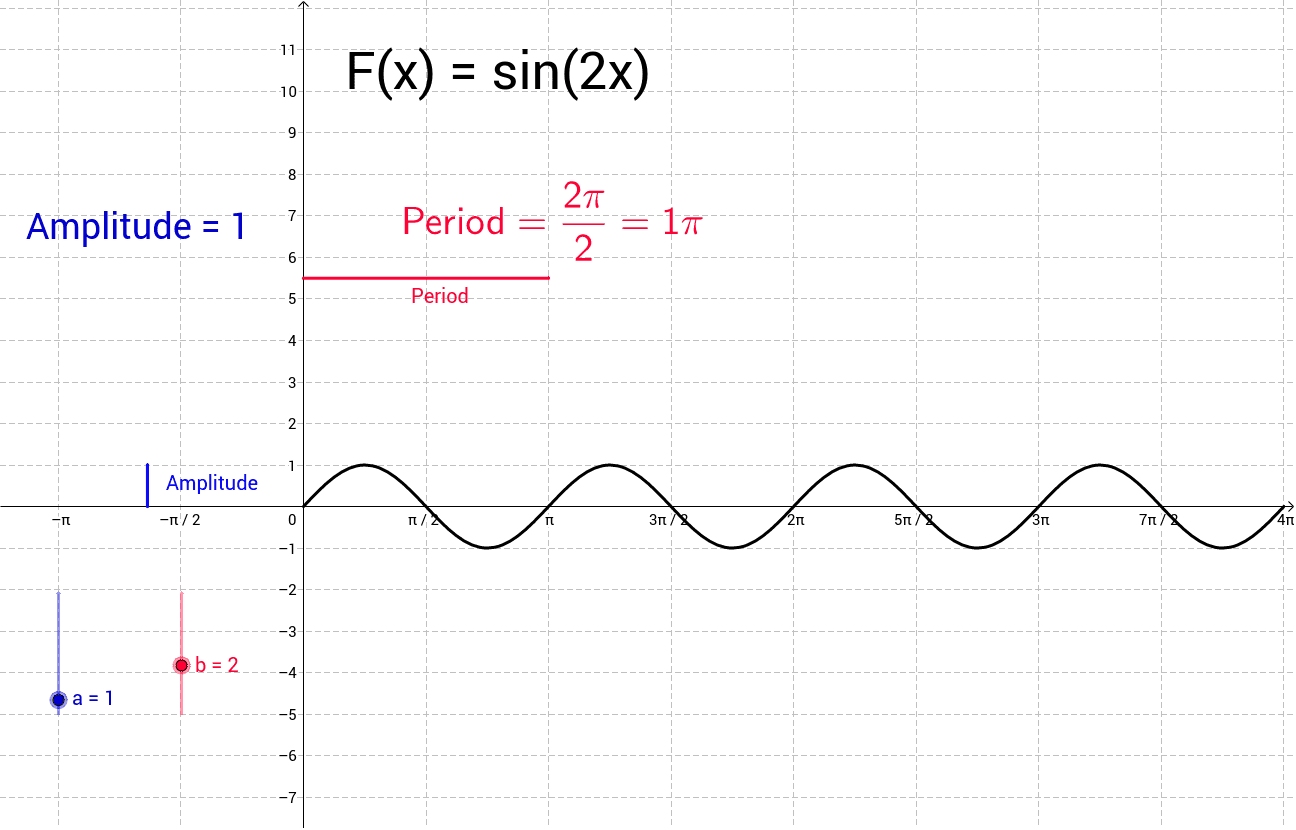
This GeoGebra example demonstrates the graph of the sine function f(x) = a·sin(bx) as the parameters a and b vary dynamically. It illustrates how the amplitude coefficient a controls vertical stretching and reflection, while the angular frequency coefficient b affects horizontal compression and period of the sine curve. Core mathematical concepts include trigonometric functions, function graphing, transformations of functions, amplitude, period, and sinusoidal curve scaling. The construction uses the GeoGebra Function command to define f, slider objects a and b to adjust parameters interactively, and supporting objects such as Segment, points A, B, C, D, and text labels text1, text2, text3 to annotate key features and values; auxiliary objects d, e, g, h support geometric construction or reference lines. Suitable for high school mathematics teaching, classroom demonstrations, student inquiry activities, and visualization practice of function transformations and trigonometric graphing.
GeoGebra Commands & Parameters
Segment(C, D) → dFunction(a * sin(b * x), 0, 12.566370614359172) → fSegment(A, B) → Amplitude