
Box Plot – Interactive Data Visualization
Loading the math board and drawing, please wait…
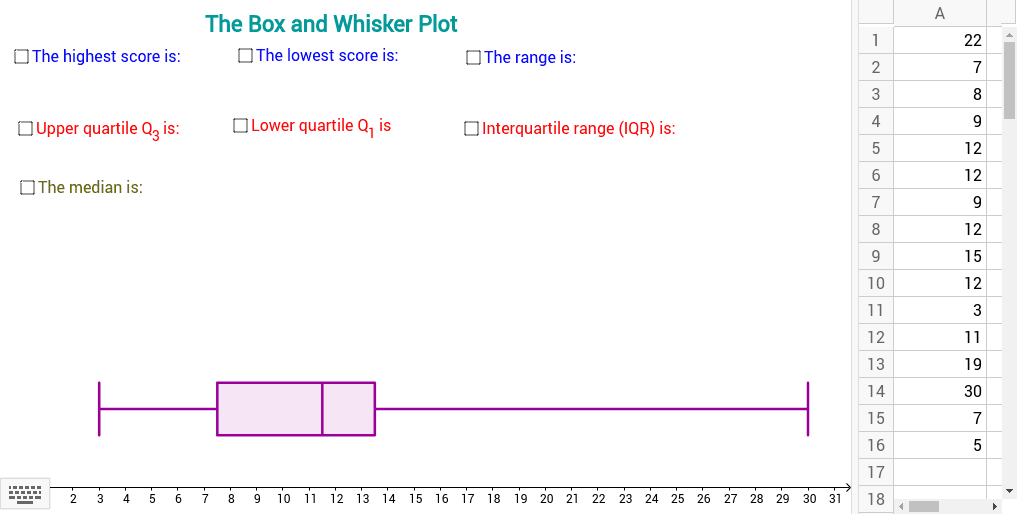
This example demonstrates how to create a box plot from spreadsheet data, allowing students to see dynamic changes when the data is altered. It illustrates key statistical concepts such as quartiles (Q1, Q3), median, minimum, maximum, and confidence intervals. The construction uses GeoGebra commands Q1, Q3, Median, Max, Min, BoxPlot, Segment and objects A1–A16, L_1, etc., to build the box and whisker lines. Designed for middle and high school students and teachers, it supports data analysis and statistics education.
GeoGebra Commands & Parameters
Q1(L_1) → bQ3(L_1) → cMedian(L_1) → dMax(L_1) → eMin(L_1) → fBoxPlot(3, 1, L_1) → aSegment(Lowest, Highest) → pSegment(Q_1, Q_3) → q
AI Drawing Prompt Reference
Draw an interactive box plot that automatically computes the minimum, maximum, first quartile, third quartile, and median from spreadsheet data, showing whiskers from min to max, a box from Q1 to Q3, and a median line inside the box; the figure updates in real time when the data changes. The plot should be fully dynamic, allowing users to edit the data table and instantly see the updated quartiles, whiskers, and median.
The prompt above was compiled from the original drawing commands and is for reference only.