
Dynamic Exploration of Quartic Polynomial Roots and Graphs
Loading the math board and drawing, please wait…
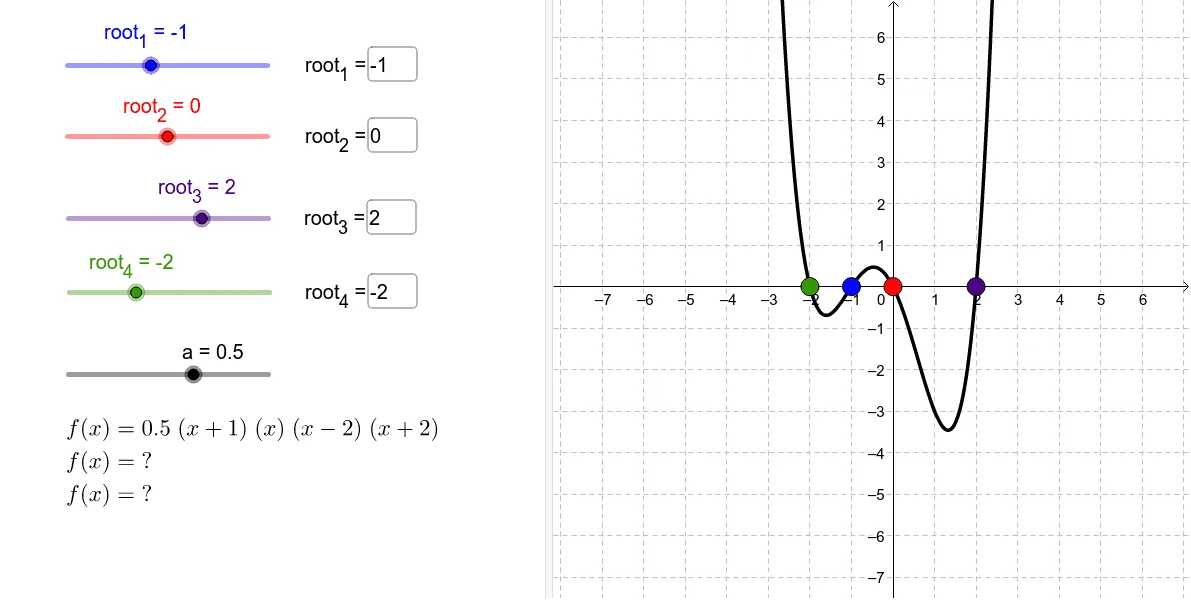
This GeoGebra example demonstrates the roots of a quartic (fourth-degree) polynomial function and their graphical representation on the coordinate plane, allowing dynamic observation of real and complex roots. The core mathematical concepts include polynomial roots, power functions, function graphing, algebraic equation solving, and the distribution of roots in the complex plane. The construction uses GeoGebra Textfield and LaTeX input boxes (inputBox1 through inputBox4) to control the leading coefficient a and polynomial terms, generating the function f and its four roots root_1 to root_4. The roots are plotted as points A, B, C, D, with text objects text2, text3, and text4 displaying their numerical values. This interactive visualization is suitable for high school algebra and functions instruction, as well as pre-calculus or undergraduate courses focusing on polynomial root visualization and classroom demonstration.
GeoGebra Commands & Parameters
Textfield(root_1) → inputBox1Textfield(root_3) → inputBox3Textfield(root_4) → inputBox4Textfield(root_2) → inputBox2LaTeX($1) → text2LaTeX($2) → text4
AI Drawing Prompt Reference
Create a dynamic visualization for a quartic (fourth-degree) polynomial: show, on the coordinate plane, both the graph of the polynomial function and its four roots (including complex roots) as corresponding points. Allow the user to input/control the numerical values of four roots and build the quartic function from them. Plot four root points and place labels beside each point that display the numerical value of the respective root. Arrange the objects so that changing the root values updates the polynomial curve and the root positions together, enabling interactive observation of how the roots distribute in the complex plane.
The prompt above was compiled from the original drawing commands and is for reference only.