
Dynamic Demonstration of the Mean of a Large Data Set
Loading the math board and drawing, please wait…
In collections
Statistics and Probability with Mr Downes
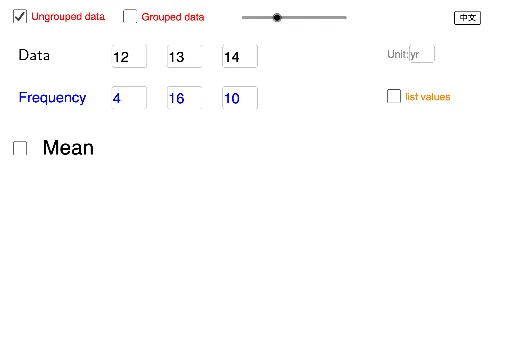
This GeoGebra example demonstrates how to dynamically compute and visualize the arithmetic mean of a large set of data using interactive input boxes and data lists. The core mathematical concepts covered include statistics, mean or average, data sequences, summation, frequency distribution, and sorting operations, making it suitable for exploring measures of central tendency in large samples. Construction-wise, the example employs GeoGebra commands such as Textfield, Sum, Sequence, and Sort, together with objects like InputBox, listD, listF, variable n, and text labels textDF and textF to control data values d1 to d5 and their corresponding frequencies f1 to f5. It is ideal for middle school and high school probability and statistics instruction, as well as classroom demonstrations of interactive data processing and mean calculation.
GeoGebra Commands & Parameters
Textfield(d_1) → InputBox1Textfield(d_2) → InputBox2Textfield(d_3) → InputBox3Textfield(d_4) → InputBox4Textfield(d_5) → InputBox5Textfield(f_1) → InputBox1fTextfield(f_2) → InputBox2fTextfield(f_3) → InputBox3fTextfield(f_4) → InputBox4fTextfield(f_5) → InputBox5fSum(Take[listF, 1, n]) → FSum(Sequence[Text[Element[listD, i]] + "\textcolor{blue}{×" + (Text[Element[listF, i] + "}+"]), i, 1, n]) → textDF_0Sum(Sequence["\textcolor{blue}{" + (Text[Element[listF, i] + "}+"]), i, 1, n]) → textF_0Sum(Zip[(m * k), m, Take[listD, 1, n], k, Take[listF, 1, n]]) → DFTextfield(textUnit) → InputBoxUnitSequence(d_1, i, 1, f_1) → list1Sequence(d_2, i, 1, f_2) → list2Sequence(d_3, i, 1, f_3) → list3Sequence(d_4, i, 1, f_4) → list4Sequence(d_5, i, 1, f_5) → list5Sort(Flatten[Take[{list1, list2, list3, list4, list5}, 1, n]]) → listJoin
AI Drawing Prompt Reference
Create a dynamic visualization that demonstrates the arithmetic mean of a large data set. Include interactive input boxes for five data values and their five corresponding frequencies. Using the frequencies, expand each data value into repeated entries to form a combined data list, then sort the flattened result to obtain the joined sequence. Compute the overall frequency sum and build a displayed weighted-sum expression showing how each data value is multiplied by its frequency and then added together. Present the key text labels that reflect the summation process and the final mean-related calculation, with the construction flowing from data entry to expansion, sorting, and summation.
The prompt above was compiled from the original drawing commands and is for reference only.