
Dynamic Demonstration of Sphere and Functions
Loading the math board and drawing, please wait…
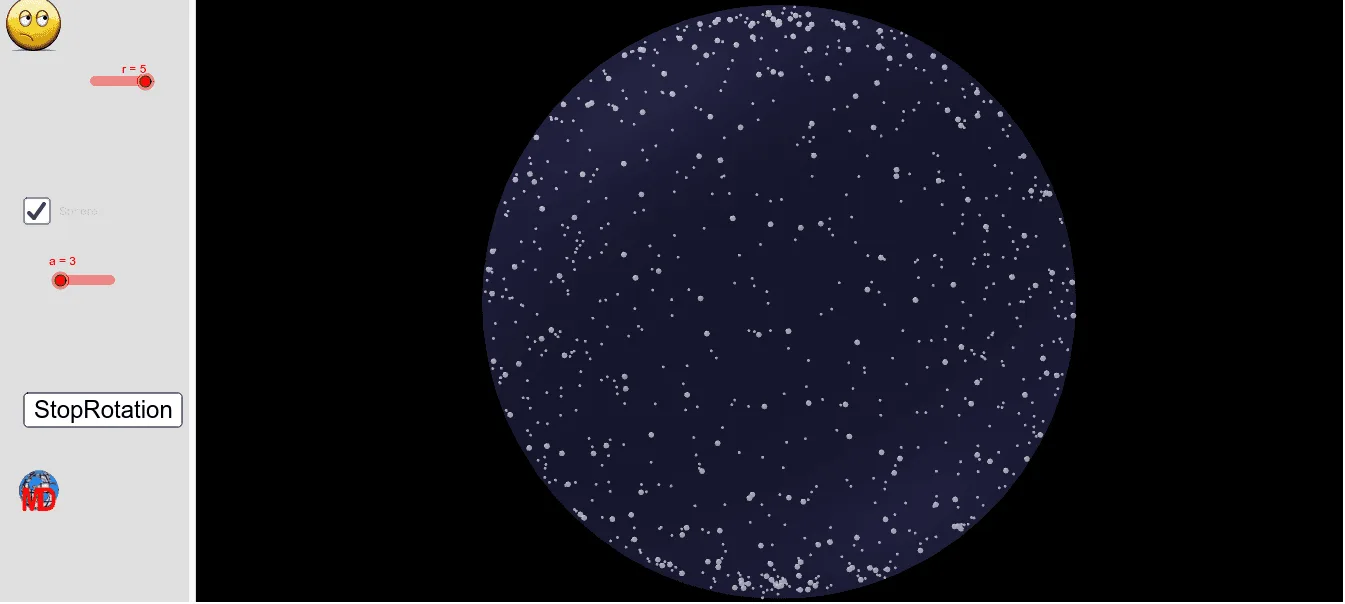
This example dynamically demonstrates the relationship between a sphere and functions. It involves core concepts of trigonometric functions, function graphs, and coordinate geometry. Using GeoGebra commands like Sequence, Mirror, and Sphere, users can intuitively understand these mathematical concepts. Suitable for high school students and teachers.
GeoGebra Commands & Parameters
Sequence((x(O) + (r * (1 + (sin(i) * cos(((2 * (Step + 0.5)) * i))))) - r, y(O) + (((r * (1 + (sin(i) * sin(((2 * (Step + 0.5)) * i))))) - r) * cos(β)), z(O) + ((((r / e * (1 + cos(i))) - r) * sin(β)) * 5.6)), i, 0, b, mm) → liste23Sequence((x(O) + (r * (1 + (sin(i) * cos(((2 * (Step + 0.5)) * i))))) - r, y(O) + (((r * (1 + (sin(i) * sin(((2 * (Step + 0.5)) * i))))) - r) * cos(β)), z(O) + ((((r * (1 + cos(i))) - r) * sin(β)) * 5.6)), i, 0, b, mm) → liste24Sequence((x(O) + (r * (1 + (sin(i) * cos(((2 * Step) * i))))) - r, y(O) + (((r * (1 + (sin(i) * sin(((2 * Step) * i))))) - r) * cos(β)), z(O) + ((((r * (1 + cos(i))) - r) * sin(β)) * 5.6)), i, 0, b, mm) → liste3Sequence((x(O) + (r * (1 + (sin(i) * cos(((2 * Step) * i))))) - r, y(O) + (((r * (1 + (sin(i) * sin(((2 * Step) * i))))) - r) * cos(β)), z(O) + ((((r / e * (1 + cos(i))) - r) * sin(β)) * 5.6)), i, 0, b, mm) → liste4Sequence((x(O) + ((((r / e * (1 + cos(i))) - r) * sin(β)) * 5.6), y(O) + (r * (1 + (sin(i) * cos(((2 * Step) * i))))) - r, z(O) + (((r * (1 + (sin(i) * sin(((2 * Step) * i))))) - r) * cos(β))), i, 0, b, mm) → liste4bSequence((x(O) + (((r * (1 + (sin(i) * sin(((2 * Step) * i))))) - r) * cos(β)), y(O) + ((((r / e * (1 + cos(i))) - r) * sin(β)) * 5.6), z(O) + (r * (1 + (sin(i) * cos(((2 * Step) * i))))) - r), i, 0, b, mm) → liste4cSequence((x(O) + (r * (1 + (sin(i) * cos(((2 * Step) * i))))) - r, y(O) + (((r * (1 + (sin(i) * sin(((2 * Step) * i))))) - r) * cos(β)), z(O) - ((((r * (1 + cos(i))) - r) * sin(β)) * 5.6)), i, 0, b, mm) → liste6Sequence((x(O) + (r * (1 + (sin(i) * cos(((2 * Step) * i))))) - r, y(O) + (((r * (1 + (sin(i) * sin(((2 * Step) * i))))) - r) * cos(β)), z(O) - ((((r / e * (1 + cos(i))) - r) * sin(β)) * 5.6)), i, 0, b, mm) → liste7Sequence(Segment[Element[liste4, i], Element[liste4, i + 1]], i, 1, Length[liste4]) → liste5Sequence(Segment[Element[liste4c, i], Element[liste4c, i + 1]], i, 1, Length[liste4]) → liste2Sequence(Segment[Element[liste6, i], Element[liste6, i + 1]], i, 1, Length[liste6]) → liste8Sequence(Segment[Element[liste7, i], Element[liste7, i + 1]], i, 1, Length[liste7]) → liste9Mirror(liste2, O) → liste2'Sphere(O, r) → j
AI Drawing Prompt Reference
Draw a sphere centered at the origin with radius r, and demonstrate its relationship with sine and cosine functions. Generate points on the sphere's surface using sine and cosine functions, and connect these points with lines to form a grid. Show two sets of grids, one based on sine and cosine functions and the other based on cosine and sine functions. Finally, reflect one set of grids across the origin to obtain a complete grid structure.
The prompt above was compiled from the original drawing commands and is for reference only.