
Drawing a Line from Slope-Intercept Equation
Loading the math board and drawing, please wait…
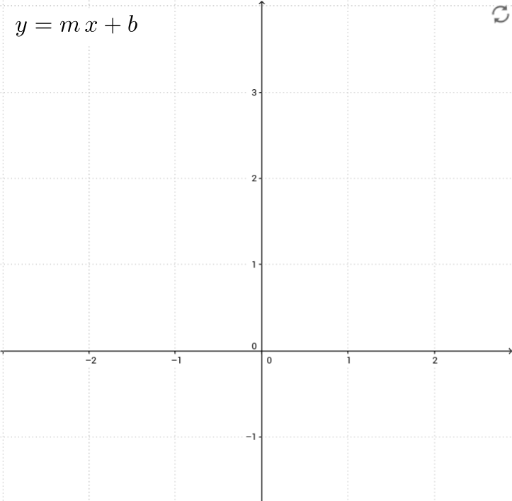
This example demonstrates how to graph a line from the slope-intercept form of a linear equation (y=mx+b). Key math concepts include slope, y-intercept, vector operations, and coordinate geometry. Construction highlights involve using GeoGebra commands like ConstructionStep, Textfield, Midpoint, and Vector, along with InputBoxes for parameter input and objects A, B, C for coordinate calculations and graphical representation. Suitable for high school students learning linear equations and their graphical interpretations.
GeoGebra Commands & Parameters
ConstructionStep() → cpTextfield(m) → InputBox1Textfield(b) → InputBox2Midpoint(A, B) → DMidpoint(B, C) → ETextfield(dx) → InputBox3Vector(A, B) → uVector(B, C) → v
AI Drawing Prompt Reference
Draw a line using the slope-intercept form y=mx+b. Input the slope m and y-intercept b, then draw the line based on these parameters. First, input the slope m, then input the y-intercept b. Calculate the midpoints D of points A and B, and E of points B and C. Finally, use the vector u between points A and B, and the vector v between points B and C to draw the line.
The prompt above was compiled from the original drawing commands and is for reference only.