
Drawing a Frequency Diagram from Grouped Data
Loading the math board and drawing, please wait…
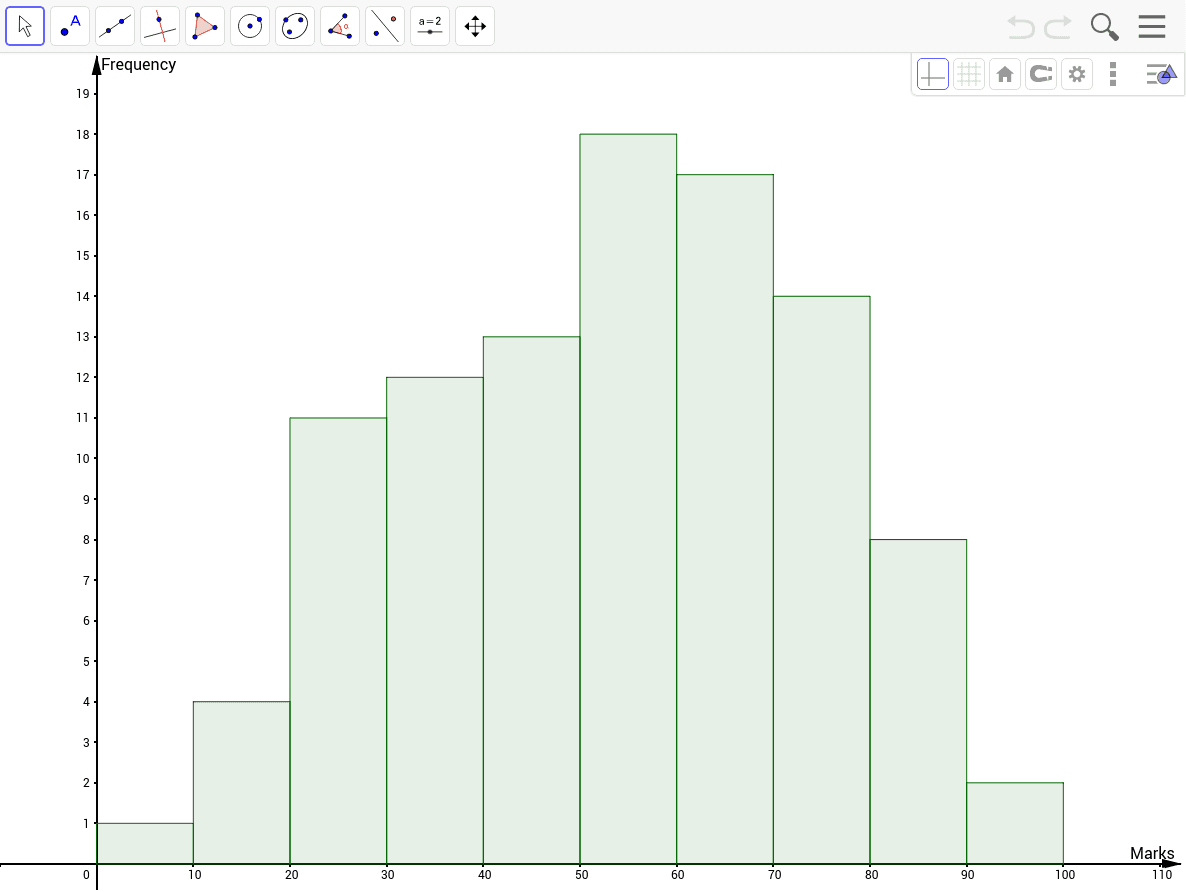
This GeoGebra example demonstrates how to construct a frequency histogram from grouped data using the Histogram commandcars. It visualizes the distribution of data across intervals, showing how frequencies vary by class. The core mathematical concepts include frequency distribution, class intervals, histogram construction, and data summarization. The construction uses the Histogram command with objects A1 through A10, list1, and parameters B and a to define bin boundaries and frequencies. This is ideal for middle or high school statistics lessons, helping students connect raw data to graphical representations and interpret distribution shapes.
GeoGebra Commands & Parameters
Histogram(B, list1) → a