
Draggable Bar (for Bar Chart etc.) Demo
Loading the math board and drawing, please wait…
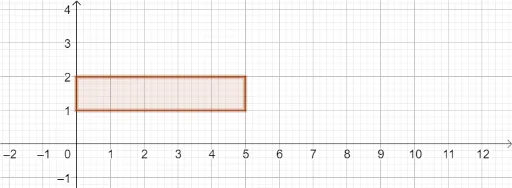
① This example demonstrates how to create a draggable bar in GeoGebra, allowing users to click and drag the bar's vertices or edges to change its height and position, commonly used for interactive bar charts, histograms, and other statistical visualizations. ② Core mathematical concepts include polygon (rectangle) geometry, coordinate changes, and dynamic data visualization through dragging points, involving intuitive adjustment of bar heights in statistical charts. ③ Construction highlights: Based on the construction summary, the Polygon command is used to create polygons, with objects P, Q, q1, p, q, f, g defined; P and Q are likely key vertices of the bar, and dragging them controls the bar's shape, while f and g may serve as auxiliary functions or constraint lines. ④ Suitable for middle school or high school mathematics and statistics lessons on bar charts, histograms, variance, or linear programming, as an interactive tool to help students understand how parameter changes affect graphical representations.
GeoGebra Commands & Parameters
Polygon(P, Q, (0, y(Q)), (0, y(P))) → q1, p, q, f, g
AI Drawing Prompt Reference
Create a draggable bar chart where users can click and drag vertices or edges to change the height and position of the bars, demonstrating interactive bar charts, histograms, and statistical visualizations. The core involves polygon geometry, coordinate transformations through dragging points, and intuitive adjustment of bar heights in statistical charts. Start by constructing a rectangle as the bar, then add auxiliary lines or functions to constrain the dragging behavior, suitable for teaching how parameter changes affect graphical representations.
The prompt above was compiled from the original drawing commands and is for reference only.