
Quadratic Functions in Vertex Form Demo
Loading the math board and drawing, please wait…
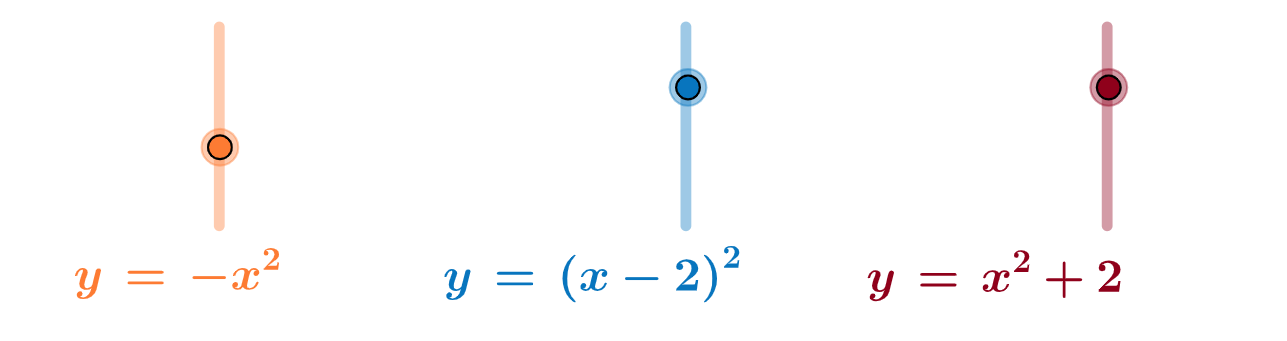
This example demonstrates the graph of quadratic functions in vertex form and the effects of parameter changes. Key math concepts include quadratic functions, vertex coordinates, and the influence of parameters a, h, k. GeoGebra commands and objects like a, b, c, h, k, d, f, g, p, q, r, text1, text2, text3, text5 are used to construct the function graph and parameter controls. Suitable for high school mathematics teaching and student understanding of quadratic function properties.
GeoGebra Commands & Parameters
Numeric a(1.8)Numeric b(-0.3)Numeric c(-1.1)Numeric h(2)Numeric k(2)Numeric d(-1)y = x^(2)y = (a * x^(2)) + (b * x) + cy = (x - h)^(2)y = (d * x^(2))y = x^(2) + k
AI Drawing Prompt Reference
Create a single coordinate-plane demonstration of quadratic function graphs. Start by showing a reference parabola y=x^2, then define parameters a, b, c and vertex-form parameters h, k. Plot the general quadratic y=(a*x^2)+(b*x)+c, also draw the vertex-shift form y=(x-h)^2, and include another scaled parabola y=(d*x^2). Finally add a vertical shift curve y=x^2+k. Display these curves together so the effect of changing the parameters on the shape and position of the parabolas is clear.
The prompt above was compiled from the original drawing commands and is for reference only.