
Drag Points to See Exponential or Logistic Function
Loading the math board and drawing, please wait…
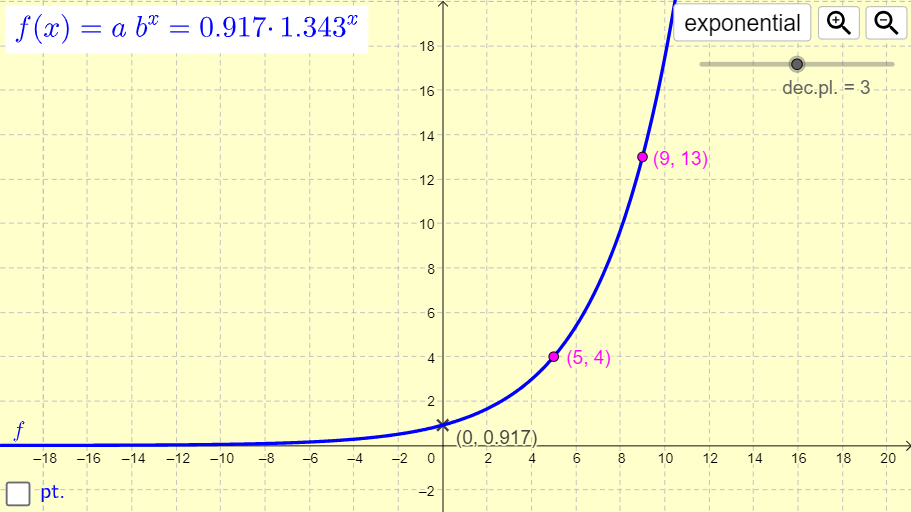
This example demonstrates how dragging two points in the x-y plane dynamically generates an exponential or logistic function and its equation. Key math concepts include exponential functions, logistic functions, function graphs, and coordinate geometry. It is constructed using GeoGebra commands like Corner, Textfield, A, B, b, a, f, etc., making it suitable for high school and above mathematics education or function graph exploration.
GeoGebra Commands & Parameters
Corner(5) → dimsTextfield(x1) → InputBox1
AI Drawing Prompt Reference
Create a coordinate system with an input box for parameters, two draggable points, and dynamically generate an exponential or logistic function graph with its equation displayed, including a label showing the image dimensions.
The prompt above was compiled from the original drawing commands and is for reference only.