
Double Integral on Rectangular Region
Loading the math board and drawing, please wait…
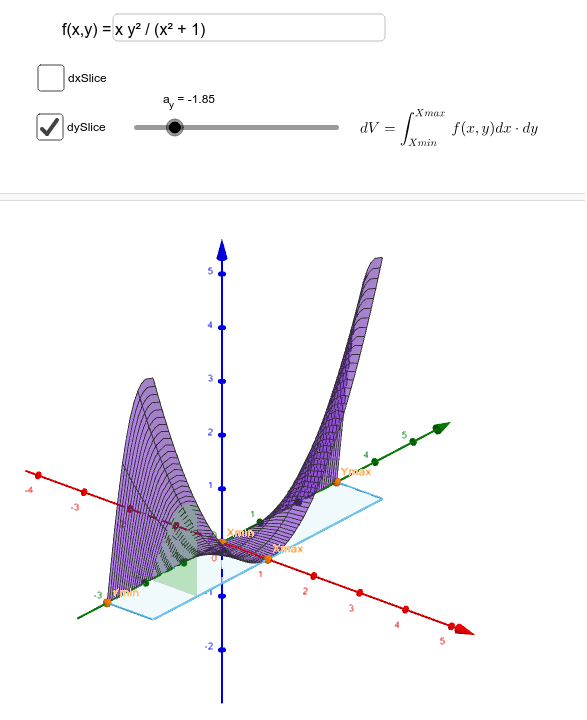
This example illustrates the use of slices in double integrals over rectangular regions. Key mathematical concepts include double integrals and rectangular regions. Using GeoGebra commands such as Point, Textfield, Surface, and Polygon, the geometric meaning of double integrals is constructed. Suitable for university-level calculus courses.
GeoGebra Commands & Parameters
Point(yAxis) → YminPoint(yAxis) → YmaxPoint(xAxis) → XmaxPoint(xAxis) → XminTextfield(f) → InputBox1Surface(u, v, f(u, v), u, xmin, xmax, v, ymin, ymax) → topSurface(a_x, v, (u * f(a_x, v)), u, 0, 1, v, ymin, ymax) → xSliceSurface(u, a_y, (v * f(u, a_y)), u, xmin, xmax, v, 0, 1) → ySlicePolygon((xmin, ymin), (xmax, ymin), (xmax, ymax), (xmin, ymax)) → poly1, g, h, i, j
AI Drawing Prompt Reference
Draw a double integral over a rectangular region. First, create Ymin and Ymax points on the y-axis, then create Xmin and Xmax points on the x-axis. Input the function f(u, v) and use the Surface command to draw the surface top over the rectangular region. Then, draw the xSlice and ySlice surfaces along the x-axis and y-axis directions, respectively. Finally, use the Polygon command to draw the boundary of the rectangular region.
The prompt above was compiled from the original drawing commands and is for reference only.