
Double Integral in Polar Coordinates Visualizer
Loading the math board and drawing, please wait…
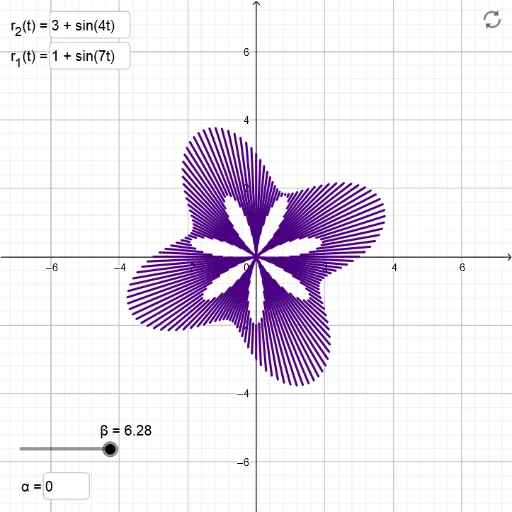
This example demonstrates how to compute a double integral in polar coordinates, visually representing the integration region and process through dynamic graphics. Core math concepts include the definition of polar coordinates, double integral computation methods, and the representation of integration regions. It utilizes GeoGebra commands and objects like Textfield, Sequence; objects: α, InputBox1, r_1, r_2, InputBox3, InputBox4, Dth, β, l1. Suitable for high school and above learners to understand and master double integral calculations in polar coordinates and visualization techniques.
GeoGebra Commands & Parameters
Textfield(α) → InputBox1Textfield(r_1) → InputBox3Textfield(r_2) → InputBox4Sequence(Segment[((r_1(th) * cos(th)), (r_1(th) * sin(th))), ((r_2(th) * cos(th)), (r_2(th) * sin(th)))], th, α, β, Dth) → l1
AI Drawing Prompt Reference
Draw a double integral visualization in polar coordinates. Input the starting angle α, ending angle β, and two radii r1 and r2. Based on the inputs, draw circular arcs from r1 to r2, and display the integration region for the double integral.
The prompt above was compiled from the original drawing commands and is for reference only.