
Polar Area Example
Loading the math board and drawing, please wait…
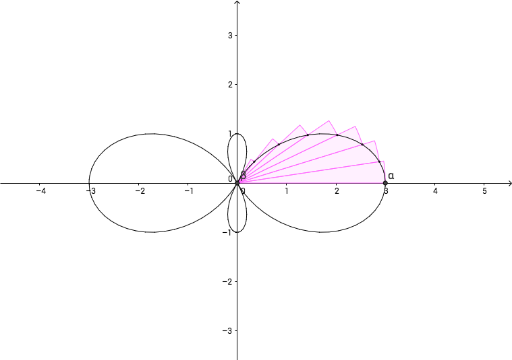
This example demonstrates how to plot polar area graphs using polar coordinate equations and calculate the area of specific regions. Key math concepts include polar coordinate systems, area calculation, integral applications, and linear equations with trigonometric relationships. GeoGebra commands like Curve, Sequence, Zip, Textfield, Last, First, Sum, Integral are used, along with objects such as r, α, β, A, B, n, Δθ, ThetaPts, LSecs, rOFtheta, αEq, βEq, Slist, Rpt, Lpt, Rtpts, RSecs, LSum, RSum, RightSum, LS, LeftSum, RS, Both, Midθpts, MS, MSum, MidSum, Mminus, Mplus, MSecs, g, Int, c_1, text1, All. Suitable for high school and above students learning polar geometry, calculus area calculations, and data analysis.
GeoGebra Commands & Parameters
CurveCartesian((r(θ) * cos(θ)), (r(θ) * sin(θ)), θ, 0, 6.283185307179586) → cSequence(c(α + (i * Δθ)), i, 0, n) → ThetaPtsZip(CircleSector[(0, 0), C, D], C, First[ThetaPts, n], D, Last[ThetaPts, n]) → LSecsTextfield(r) → rOFthetaTextfield(α) → αEqTextfield(β) → βEqLast(ThetaPts, n) → RptFirst(ThetaPts, n) → LptZip((Length[A]; Angle[B]), A, Rpt, B, Lpt) → RtptsZip(CircleSector[(0, 0), E, F], E, Rtpts, F, Last[ThetaPts, n]) → RSecsSum(Sequence[((0.5 * r(α + (i * Δθ))^(2)) * Δθ), i, 0, n - 1]) → LSumSum(Sequence[((0.5 * r(α + (i * Δθ))^(2)) * Δθ), i, 1, n]) → RSumSequence(c(α + ((i - 1 / 2) * Δθ)), i, 1, n) → MidθptsSum(Zip[((0.5 * R^(2)) * Δθ), R, Midθpts]) → MSumZip((Length[A]; Angle[B]), A, Midθpts, B, First[ThetaPts, n]) → MminusZip((Length[A]; Angle[B]), A, Midθpts, B, Last[ThetaPts, n]) → MplusZip(CircleSector[(0, 0), E, F], E, Mminus, F, Mplus) → MSecsIntegral(g, α, β) → Int
AI Drawing Prompt Reference
Draw a polar area graph to demonstrate how to plot and calculate the area of specific regions using polar coordinate equations. Start by plotting the polar curve, then divide the area into sectors based on angles, representing each sector with a fan shape and labeling key angles and radii. Calculate the area of each sector and sum them to show the application of integration in area calculations, finally distinguishing the integral regions on both sides with different colors.
The prompt above was compiled from the original drawing commands and is for reference only.