
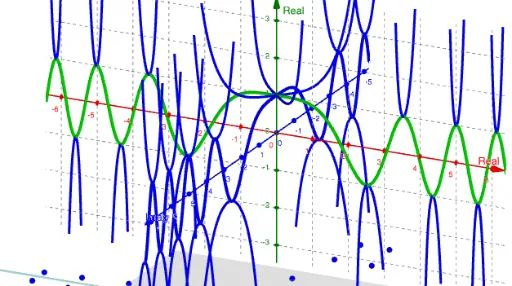
Phantom Graph of cos(x^2/2)
Loading the math board and drawing, please wait…
In collections
Phantom Graphs
This example demonstrates the phantom graph of the function cos(x^2/2). It involves the concept of trigonometric functions. Using GeoGebra commands such as Plane, CurveCartesian, Sequence, etc., the graph of the function can be constructed. Suitable for high school mathematics education or learning.
GeoGebra Commands & Parameters
Plane((0, c, 0), (1, c, 0), (0, c, 1)) → pCurveCartesian(0, cos(t^(2) / 2), t, t, -25, 25) → aSequence(CurveCartesian[sqrt(t^(2) + ((2 * k) * π)), ((-1)^(k) * cosh((t * sqrt(t^(2) + ((2 * k) * π))))), t, t, -25, 25], k, -10, 10) → Curve1Sequence(CurveCartesian[(-sqrt(t^(2) + ((2 * k) * π))), ((-1)^(k) * cosh((t * sqrt(t^(2) + ((2 * k) * π))))), t, t, -25, 25], k, -10, 10) → Curve2Sequence(((-sqrt((2 * acos(c)) + ((4 * k) * π))), c), k, -5, 5) → PtsCR2Sequence((sqrt((2 * acos(c)) + ((4 * k) * π)), c), k, -5, 5) → PtsCR1Sequence((sqrt(((4 + (4 * k)) * π) - (2 * acos(c))), c, 0), k, -5, 5) → PtsCR3Sequence(((-sqrt(((4 + (4 * k)) * π) - (2 * acos(c)))), c, 0), k, -5, 5) → PtsCR4Sequence((0, c, sqrt(((4 + (4 * k)) * π) - (2 * acos(c)))), k, 0, 5) → PtsCosPHG3Sequence((0, c, sqrt((2 * acos(c)) + ((4 * k) * π))), k, 0, 5) → PtsCosPHG1Sequence((0, c, (-sqrt((2 * acos(c)) + ((4 * k) * π)))), k, 0, 5) → PtsCosPHG2Sequence((0, c, (-sqrt(((4 + (4 * k)) * π) - (2 * acos(c))))), k, 0, 5) → PtsCosPHG4Sequence((sqrt((π * k) + sqrt((k^(2) * π^(2)) + acosh(c)^(2))), c, sqrt((-((π * k))) + sqrt((k^(2) * π^(2)) + acosh(c)^(2)))), k, -6, 6, 2) → PtsCoshPG1Sequence(((-sqrt((π * k) + sqrt((k^(2) * π^(2)) + acosh(c)^(2)))), c, sqrt((-((π * k))) + sqrt((k^(2) * π^(2)) + acosh(c)^(2)))), k, -6, 6, 2) → PtsCoshPG2Sequence((sqrt((π * k) + sqrt((k^(2) * π^(2)) + acosh(c)^(2))), c, (-sqrt((-((π * k))) + sqrt((k^(2) * π^(2)) + acosh(c)^(2))))), k, -6, 6, 2) → PtsCoshPG3Sequence(((-sqrt((π * k) + sqrt((k^(2) * π^(2)) + acosh(c)^(2)))), c, (-sqrt((-((π * k))) + sqrt((k^(2) * π^(2)) + acosh(c)^(2))))), k, -6, 6, 2) → PtsCoshPG4Sequence((sqrt((π * k) + sqrt((k^(2) * π^(2)) + acosh((-c))^(2))), c, sqrt((-((π * k))) + sqrt((k^(2) * π^(2)) + acosh((-c))^(2)))), k, -5, 7, 2) → PtsCoshPG5Sequence(((-sqrt((π * k) + sqrt((k^(2) * π^(2)) + acosh((-c))^(2)))), c, sqrt((-((π * k))) + sqrt((k^(2) * π^(2)) + acosh((-c))^(2)))), k, -5, 7, 2) → PtsCoshPG6Sequence((sqrt((π * k) + sqrt((k^(2) * π^(2)) + acosh((-c))^(2))), c, (-sqrt((-((π * k))) + sqrt((k^(2) * π^(2)) + acosh((-c))^(2))))), k, -5, 7, 2) → PtsCoshPG7Sequence(((-sqrt((π * k) + sqrt((k^(2) * π^(2)) + acosh((-c))^(2)))), c, (-sqrt((-((π * k))) + sqrt((k^(2) * π^(2)) + acosh((-c))^(2))))), k, -5, 7, 2) → PtsCoshPG8
AI Drawing Prompt Reference
Draw the phantom graph of the function cos(x^2/2). Start by drawing a plane on the x-axis, then plot the main curve. Use sequence commands to draw a series of phantom lines around the main curve, extending upwards and downwards with varying k values. Finally, plot a series of points around the main curve to form the endpoints of the phantom lines.
The prompt above was compiled from the original drawing commands and is for reference only.