
Dotplot and Statistical Characteristics Demo
Loading the math board and drawing, please wait…
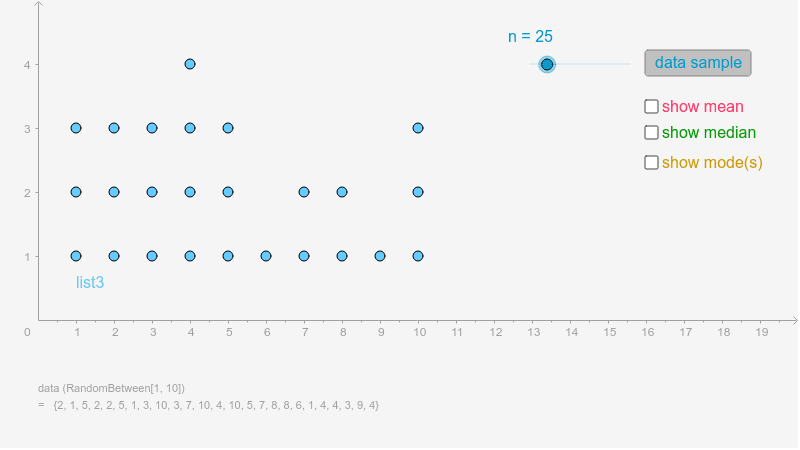
This example demonstrates how to create a dotplot and visualize statistical characteristics such as the arithmetic mean, median, and mode. It involves core math concepts like scatter plots, statistical features, variance, Pythagorean theorem, algebra, and parabolas. The construction uses GeoGebra commands like Sequence, DotPlot, Mean, Frequency, Median, and Mode. Suitable for high school mathematics education or statistics learning.
GeoGebra Commands & Parameters
Sequence(Random[1, 10], i, 1, n) → list1DotPlot(list1) → list3Mean(list1) → meanFrequency(list1) → list2Median(list1) → medianMode(list1) → list4
AI Drawing Prompt Reference
Create a dot plot for a dataset and display the arithmetic mean, frequency distribution, median, and mode below the dot plot. First, generate a list of random numbers between 1 and 10, then create the dot plot using this list. Next, calculate and display the arithmetic mean, frequency distribution, median, and mode of the list.
The prompt above was compiled from the original drawing commands and is for reference only.