
Distributions and Skewness
Loading the math board and drawing, please wait…
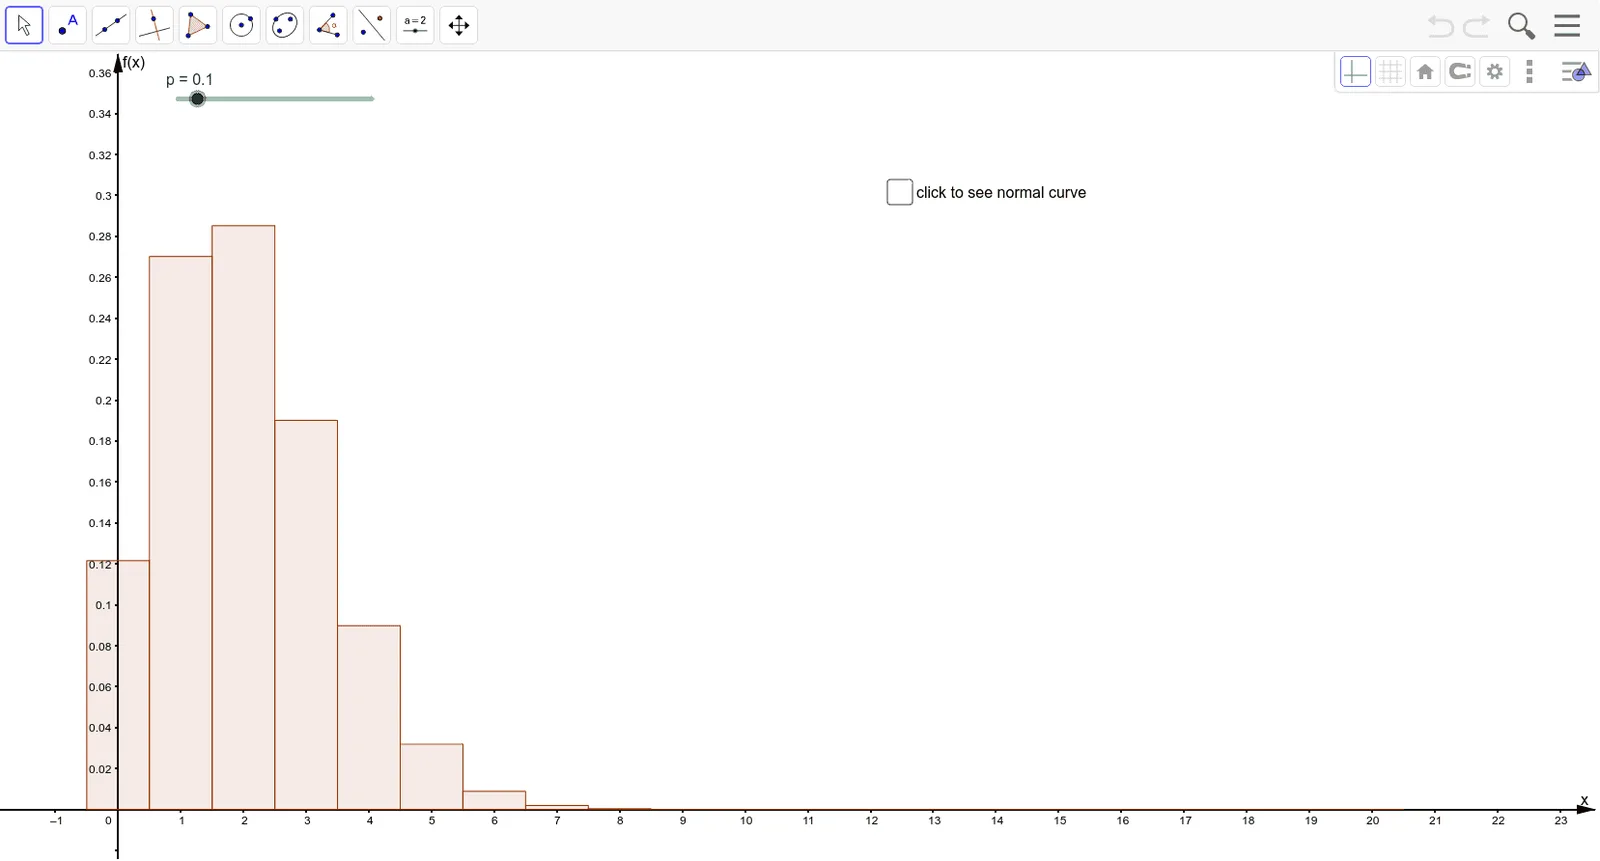
This example demonstrates the graphical representation of normal and binomial distributions along with their skewness characteristics. Key math concepts include probability distributions, histograms, mean, standard deviation, and skewness. It uses GeoGebra commands like BinomialDist and Normal, with objects p, f, g, a for parameter control and visualization. Suitable for high school students and math enthusiasts studying probability statistics and data analysis.
GeoGebra Commands & Parameters
BinomialDist(20, p) → fNormal((20 * p), sqrt(((20 * p) * (1 - p))), x) → g