
Displacement vs Time Graph and Derivative Analysis
Loading the math board and drawing, please wait…
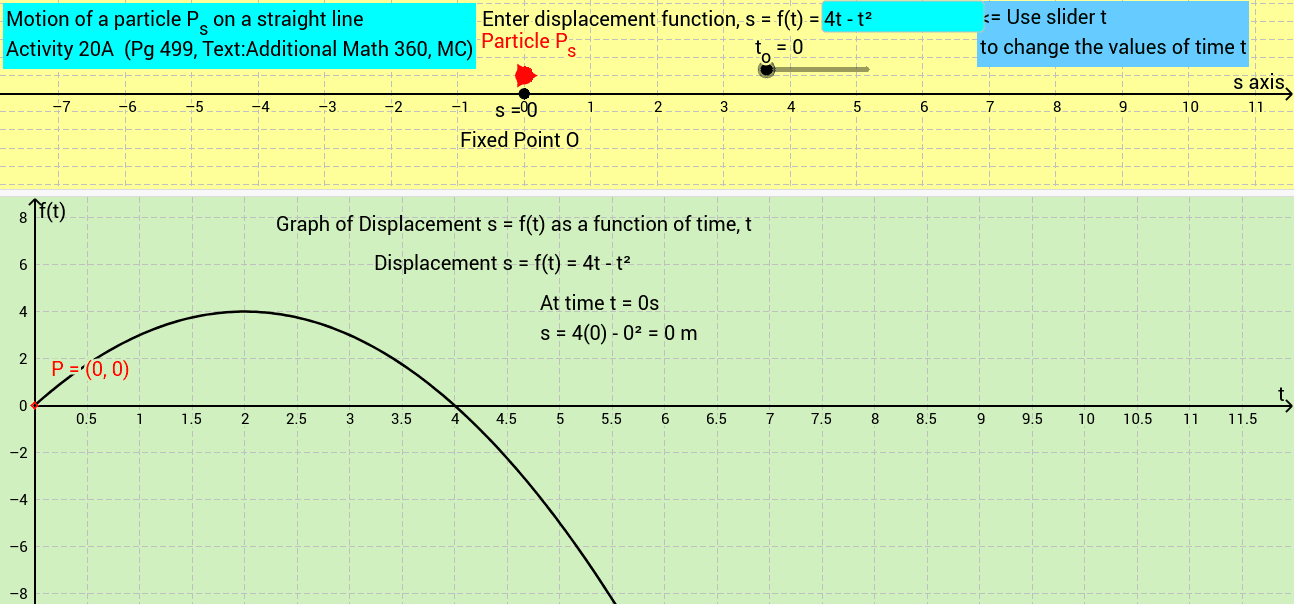
This interactive example demonstrates the relationship between a displacement-time (s-t) graph and its derivative, representing velocity. The core mathematical concepts involve function graphing, the definition of instantaneous velocity, and the application of calculus in kinematics. The construction utilizes GeoGebra's 'Function' command to plot displacement and the 'Derivative' command to derive the velocity curve. Interactive elements such as 'Textfield' and 'inputBox' allow users to modify parameters, while point 'P' and various text objects provide real-time data visualization. This tool is ideal for high school students studying Additional Mathematics or Physics to visualize the fundamental link between position and velocity.
GeoGebra Commands & Parameters
Textfield(f_m) → inputBox1Function(f_m, 0, 100) → f_dmDerivative(f_dm) → v
AI Drawing Prompt Reference
Draw a displacement-time graph where the displacement function over time can be input by the user. Then, calculate and display the derivative of this function, which represents the velocity curve. Users can modify the function expression through an input box to observe real-time changes in the displacement and velocity curves.
The prompt above was compiled from the original drawing commands and is for reference only.