
Direct and Partial Variation Demo
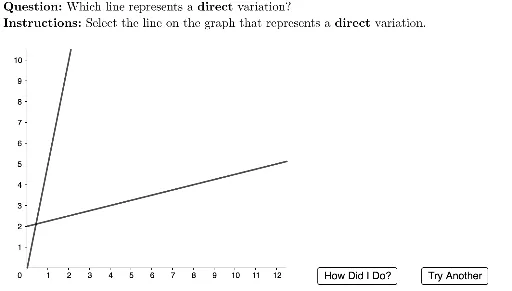
Loading the math board and drawing, please wait…
This example demonstrates the graphical representation of direct and partial variation relationships. It involves core math concepts like linear equations, expected value, similar triangles, trapezoids, and parametric curves. Constructed using GeoGebra commands such as UnicodeToLetter, Random, If, LaTeX, Polygon, Min, and objects like sliders and loci. Suitable for middle school and above, focusing on variable relationships and geometric constructions.
GeoGebra Commands & Parameters
UnicodeToLetter(10007) → xmarkUnicodeToLetter(10003) → cmarkRandom(1, 5) → mDirectTempRandom(1, 5) → mPartialTempRandom(1, 5) → bPartialIf(Random[1, 2] ≟ 1, mDirectTemp, 1 / mDirectTemp) → mDirectIf(Random[1, 2] ≟ 1, mPartialTemp, 1 / mPartialTemp) → mPartialRandom(1, 2) → typeLaTeX((("\textbf{Question: }Which line represents a \textbf{" * If[type ≟ 1, "direct", "partial"]) * "} variation?")) → QUESTIONLaTeX((("\textbf{Instructions: }Select the line on the graph that represents a \textbf{" * If[type ≟ 1, "direct", "partial"]) * "} variation.")) → INSTRUCTIONSPolygon({(-1, -1), (-1, 10.5), (12.5, 11), (12.5, -1)}) → viewBoxMin(12.5, 10.5 / mDirect) → directLineMaxXMin(12.5, (10.5 - bPartial) / (mPartial)) → partialLineMaxX