
Dijkstra Algorithm Visualization
Loading the math board and drawing, please wait…
In collections
Shortest path
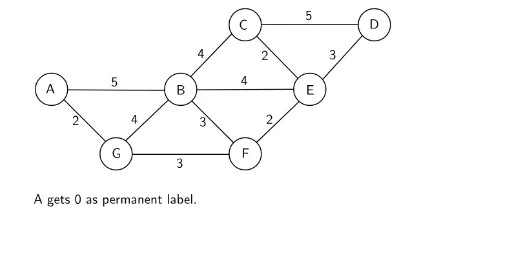
This example demonstrates the application of Dijkstra's algorithm in graph theory, visually showing the process of finding the shortest path. Core math concepts include graph theory, shortest path, greedy algorithm. Construction highlights involve GeoGebra commands/objects like ConstructionStep, Circle, Point, Segment. Suitable for high school students and learners interested in graph theory algorithms.
GeoGebra Commands & Parameters
ConstructionStep() → stapCircle(A, 0.5) → cCircle(B, 0.5) → dCircle(C, 0.5) → eCircle(D, 0.5) → fCircle(E, 0.5) → gCircle(F, 0.5) → hCircle(G, 0.5) → kPoint(c) → HPoint(d) → ISegment(H, I) → iPoint(e) → JPoint(d) → KSegment(J, K) → jPoint(e) → LPoint(f) → MSegment(L, M) → lPoint(f) → NPoint(g) → OSegment(N, O) → mPoint(e) → PPoint(g) → QSegment(P, Q) → nPoint(g) → RPoint(h) → SSegment(R, S) → pPoint(d) → TPoint(g) → USegment(T, U) → qPoint(d) → VPoint(h) → WSegment(V, W) → rPoint(h) → ZPoint(k) → A_1Segment(Z, A_1) → sPoint(k) → B_1Point(d) → C_1Segment(B_1, C_1) → tPoint(k) → D_1Point(c) → E_1Segment(D_1, E_1) → aCircle(A, 0.5) → c_1Circle(G, 0.5) → d_1Segment(D_1, E_1) → bCircle(F, 0.5) → e_1Segment(Z, A_1) → f_1Circle(E, 0.5) → g_1Circle(B, 0.5) → h_1Segment(R, S) → i_1Circle(C, 0.5) → k_1Segment(P, Q) → j_1Circle(D, 0.5) → p_1Segment(N, O) → l_1
AI Drawing Prompt Reference
Visualize Dijkstra's algorithm for finding the shortest path in graph theory. Include multiple circles, points, and segments: first draw six circles with labeled centers, then connect the centers with segments, and further connect points on the circle peripheries to form a complex network, highlighting the path search process.
The prompt above was compiled from the original drawing commands and is for reference only.