
Differentiability and Continuity
Loading the math board and drawing, please wait…
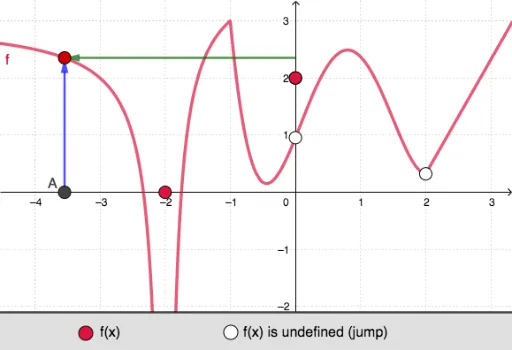
This example illustrates the relationship between differentiability and continuity. Key mathematical concepts include the continuity and differentiability of functions. Using GeoGebra commands such as Point, Segment, Vector, Polygon, etc., functions f, g, h, etc., are constructed and their continuity and differentiability are observed. Suitable for high school mathematics education and learning.
GeoGebra Commands & Parameters
Point(r) → FPoint(r) → GPoint(r) → IPoint(r) → JPoint(r) → KPoint(r) → LPoint(r) → MPoint(r) → NSegment(L, K) → iSegment(I, J) → jSegment(F, G) → kSegment(M, N) → lVector(A, H) → uPolygon((-10, -2.1), (10, -2.1), (10, -10), (-10, -10)) → q1, m, n, s, tVector(O, H) → v
AI Drawing Prompt Reference
Draw a function graph to illustrate the relationship between continuity and differentiability. First, mark four points F, G, I, and J on the coordinate axis, then connect these points to form segments i, j, k, and l. Next, draw a rectangle q1 with vertices at (-10, -2.1), (10, -2.1), (10, -10), and (-10, -10). Finally, draw a vector v from the origin O to point H, and a vector u from point A to point H.
The prompt above was compiled from the original drawing commands and is for reference only.