
Difference- and differential quotient
Loading the math board and drawing, please wait…
In collections
Selected Examples
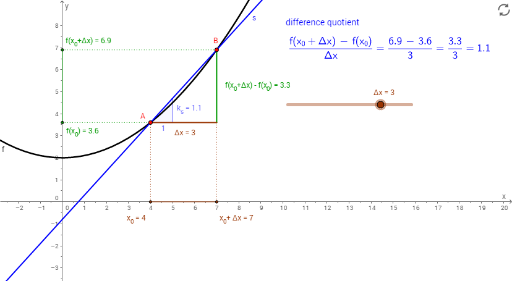
This example demonstrates the geometric representation of transitioning from difference to differential quotient, involving key concepts in calculus. It uses GeoGebra commands like Point, Segment, Line, Slope to construct the visualization. Suitable for high school students learning calculus basics or for geometric construction teaching.
GeoGebra Commands & Parameters
Point(f) → ASegment(A_1, A) → f_3Segment(B_1, B) → f_2Line(A, B) → sSlope(s) → k_sMidpoint(A, C) → M_1Midpoint(C, B) → M_2Segment(E, C) → cSegment(D, B) → dSegment(C, B) → eSegment(A, C) → gSegment(A_1, B_1) → hSegment(E, D) → iTangent(A, f) → tSlope(t) → k_t
AI Drawing Prompt Reference
Draw a geometric representation of transitioning from difference to differential quotient. Include points, line segments, lines, and slopes to illustrate basic calculus concepts. The construction should start with points, then draw line segments and lines, and finally calculate slopes to show rate of change.
The prompt above was compiled from the original drawing commands and is for reference only.