
Dice Game Simulation
Loading the math board and drawing, please wait…
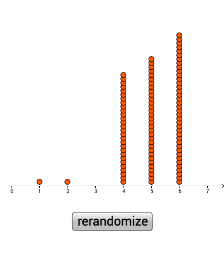
This example simulates a dice game. It involves probability and statistics. Using GeoGebra commands such as Random, If, and DotPlot, the distribution of dice rolls can be constructed. Suitable for students in middle school and above for learning probability and statistics.
GeoGebra Commands & Parameters
Random(1, 6) → A1Random(1, 6) → A2Random(1, 6) → A3Random(1, 6) → A4Random(1, 6) → A5Random(1, 6) → A6If(B1 ≟ 0, 0, If[B1 ≥ 4, 0, A2]) → B2If(B2 ≟ 0, 0, If[B2 ≥ 4, 0, A3]) → B3If(B3 ≟ 0, 0, If[B3 ≥ 4, 0, A4]) → B4If(B4 ≟ 0, 0, If[B4 ≥ 4, 0, A5]) → B5If(B5 ≟ 0, 0, If[B5 ≥ 4, 0, A6]) → B6If(B2 ≟ 0, C1, B2) → C2If(B3 ≟ 0, C2, B3) → C3If(B4 ≟ 0, C3, B4) → C4If(B5 ≟ 0, C4, B5) → C5If(B6 ≟ 0, C5, B6) → C6DotPlot(data, false, 0.2) → list1
AI Drawing Prompt Reference
Simulate a dice game by rolling six dice randomly, display their results as a dot plot to show the distribution, include a slider to control the number of simulations, filter out certain results using conditional logic, and generate a clear probability and statistics graph.
The prompt above was compiled from the original drawing commands and is for reference only.