
Derivatives of Inverse Functions by Varada Vaughan
Loading the math board and drawing, please wait…
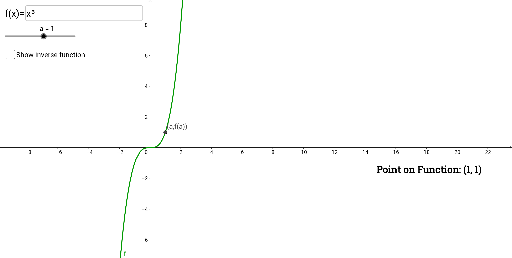
This example demonstrates how to graph inverse functions and their derivatives, dynamically showing the relationship between them. Key math concepts include inverse function definition, geometric meaning of derivatives, and tangent slope. GeoGebra commands like Invert, Tangent, Textfield, Slope, and Slider are used to plot functions, calculate tangents, and create interactive visualizations. Suitable for high school and above learners to understand inverse function properties and derivative applications.
GeoGebra Commands & Parameters
Invert(f) → gTangent(A, f) → hTangent(B, g) → iTextfield(f) → InputBox1Slope(h) → mSlope(i) → m_1
AI Drawing Prompt Reference
Draw a graph showing a function and its inverse, along with their tangent lines at corresponding points. Start by plotting the original function curve, then add its inverse curve reflected across the line y=x. Place a movable point on the original curve and draw its tangent line, displaying the slope value. Simultaneously, mark the symmetric point on the inverse curve and draw its tangent line, also showing its slope. Include an input box to edit the original function expression, allowing the graph to update dynamically. The final image should contain two curves, two tangent lines, two slope labels, and the symmetry line, illustrating the reciprocal relationship between the derivatives of inverse functions.
The prompt above was compiled from the original drawing commands and is for reference only.