
Modified Binomial Distribution Demo
Loading the math board and drawing, please wait…
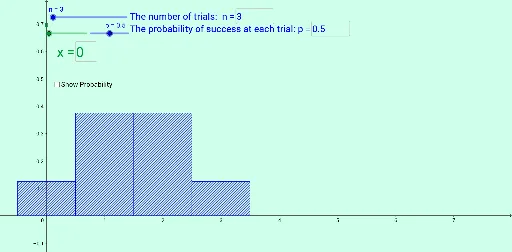
This example demonstrates the modification and visualization of the binomial distribution by dynamically adjusting parameters n and p. It involves core math concepts like binomial distribution, probability & statistics, and coordinate geometry. Constructed using GeoGebra commands/objects such as Sequence, BinomialDist, Textfield, Element, and Slider. Suitable for high school students and math enthusiasts for learning and exploring probability statistics.
GeoGebra Commands & Parameters
Sequence(((Binomial[n, k] * p^(k)) * (1 - p)^(n - k)), k, 0, n) → list1Sequence(Sum[list1, k], k, 1, n + 1) → list2BinomialDist(n, p) → aTextfield(p) → inputBox1Textfield(n) → inputBox2Element(list1, S + 1) → bElement(list2, S + 1) → cTextfield(S) → inputBox3Sequence((i, Element[list1, i + 1]), i, 0, n) → list3
AI Drawing Prompt Reference
Create a visualization demonstrating the modification and visualization of the binomial distribution with dynamically adjustable parameters n and p, showing probability distributions as sequences and their sums, including input fields for parameters and results, and highlighting individual probability values with another sequence, combining probability statistics and coordinate geometry.
The prompt above was compiled from the original drawing commands and is for reference only.