
Derivative Practice Corner: Visualizing Derivatives Graphically
Loading the math board and drawing, please wait…
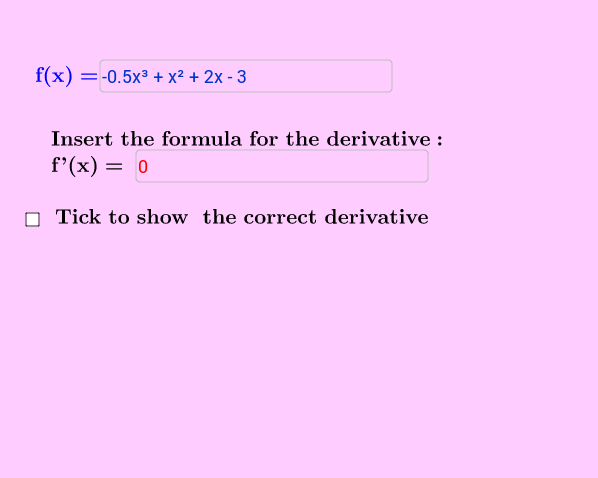
① This applet demonstrates the graphical interpretation of the derivative for any user‑defined function, showing how the tangent slope varies with the independent variable. ② Core mathematical concepts include the definition of the derivative, tangent lines, slope functions, and the geometric meaning of the derivative function. ③ Construction highlights: Textfield and InputBox for editable function input; Point to mark the variable point A; Tangent to draw the tangent at A; Slope to compute the tangent’s slope; Derivative to generate the derivative function f' and its graph g. Key objects are f, f', A, b, m, B, c, and several text labels. ④ Suitable for high‑school calculus introduction, undergraduate calculus review, and classroom demonstrations to build geometric intuition about derivatives.
GeoGebra Commands & Parameters
Textfield(f) → inputBox1Point(f) → ATangent(A, f) → bSlope(b) → mDerivative(f) → f'Textfield(g) → inputBox2
AI Drawing Prompt Reference
Please draw a graph that demonstrates the concept of derivatives. First, create an editable input box where users can define any function. Then, mark a variable point on the function's graph and draw the tangent line at that point. Calculate the slope of the tangent and generate the derivative function along with its graph. Finally, create another input box to display the expression of the derivative function. This graph shows the geometric meaning of derivatives and how the slope of the tangent varies with the independent variable.
The prompt above was compiled from the original drawing commands and is for reference only.