
Derivative Plot by Doug Kuhlmann
Loading the math board and drawing, please wait…
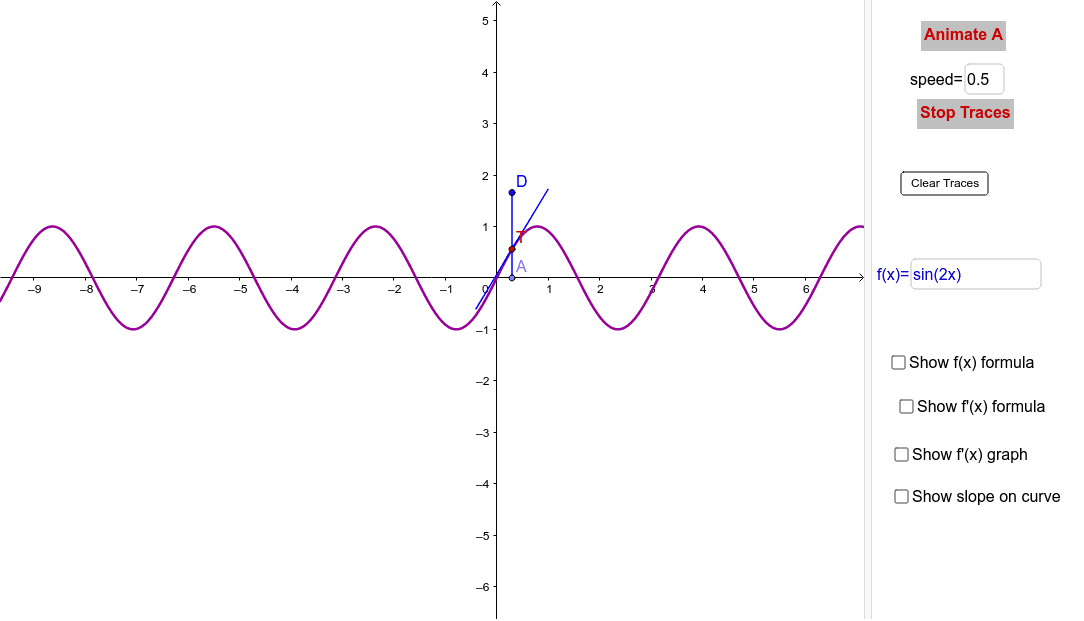
This example illustrates the concept of derivatives by plotting the function graph and its tangent slope, demonstrating the geometric meaning of derivatives. Key mathematical concepts include derivatives, tangent slope, and function graphs. It utilizes commands such as Segment, Point, If, Line, Slope, and Textfield in GeoGebra. Suitable for high school mathematics education, particularly in calculus courses.
GeoGebra Commands & Parameters
Segment((xmn, 0), (xmx, 0)) → aPoint(a) → ASegment(T - (0.7 * (1, m)), T + (0.7 * (1, m))) → TanSegIf(togA ≟ 1, "Stop animation", "Animate A") → AnimateSegment(A, D) → ADLine(T, T + (1, m)) → TanLineSlope(TanSeg) → m_1Textfield(f) → InputfOFxTextfield(speed) → InputSpdIf(togT ≟ 0, "Show Traces", "Stop Traces") → ShowTraces