
Derivative Maximum Problem Demonstration
Loading the math board and drawing, please wait…
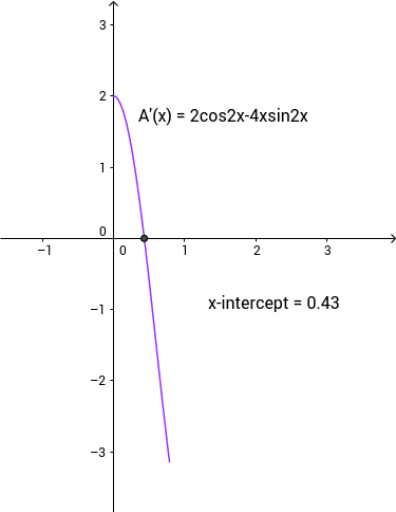
This example demonstrates how to construct and analyze the maximum value of a function's derivative under specific conditions using GeoGebra. The core mathematical concepts involved include derivatives, continuity, right triangles, arithmetic operations, unit circle, and power functions. The construction highlights the use of the Intersect command to find intersections between the function f and point A, with text objects text1 and text2 displaying the results. Suitable for high school and above learners to understand the application of derivatives in optimization problems.
GeoGebra Commands & Parameters
Intersect(f, xAxis, (0.4301667934975584, 8.409665630537688E-9)) → A
AI Drawing Prompt Reference
Draw a function graph and show the maximum value of its derivative at a specific point. First, display the intersection of the function with the x-axis, then draw a vertical line segment at this intersection point and label it. Next, plot the derivative curve of the function at this point and find its intersection with the x-axis. Finally, label the coordinates of these key points with text to analyze the maximum value of the derivative problem.
The prompt above was compiled from the original drawing commands and is for reference only.